
BioProfile analysis · gut scan
Your result in 3 minutes

Your gut score over the past few weeks, with the reading band it falls in and, for each question, the number that pulled your score down or up. All of it on your own screen, in your dashboard, and again in two weeks.
Six questions about the past few weeks, modelled on two validated symptom scales for the stomach and the gut. You get a gut score from 0 to 100 with its reading band. An analysis of your answers, never a diagnosis.
Free
6 questions
About 3 minutes
Score from 0 to 100
Fill in your first name and email address, and your gut score is in your dashboard.
(and the evidence based reason why it is precisely these six)
After lunch your trousers sit tighter than before. Your bowel movements are a lottery: three days of nothing, then a morning when you dare not leave the house. A sandwich sometimes does nothing and sometimes everything. And at the GP it gets no further than a pat on the shoulder, because you are not ill. You just have a belly you cannot count on.
The awkward thing about gut symptoms is that there is so much for sale. A stool test, an intolerance test, a microbiome analysis with a forty-page report. What is not for sale is an honest starting value: how much trouble, how often, from what. And without that starting value you still do not know after the test whether things are getting better, because you do not remember what your gut was like yesterday.
Researchers who did want to measure gut symptoms did it with two things: the form of your stool, which tells you surprisingly well how fast transit is, and the symptoms themselves, in clusters. Six questions about a few weeks, added up into a score from 0 to 100. Not a diagnosis. But a number. And a number you can follow.
A probiotic. Gluten out, dairy out, a diet with a five-letter abbreviation, more fibre, less fibre. All of it understandable, and all of it starts in the same place: with what you are going to do about it.
So a month later you still do not know whether it did anything. You have not written down anywhere how your belly was when you started, and gut complaints are exactly the complaints that jump around from day to day. Without a starting value, every change is a feeling about a feeling.
We analyse the real cause first
At BioProfile we turn the order around. First measure what is there now, with questions modelled on scales that someone else has validated, and only then talk about what you do with it. Analyse, and only then advise.
The gut scan is the first step of that analysis, and an honest first step before any test at all.
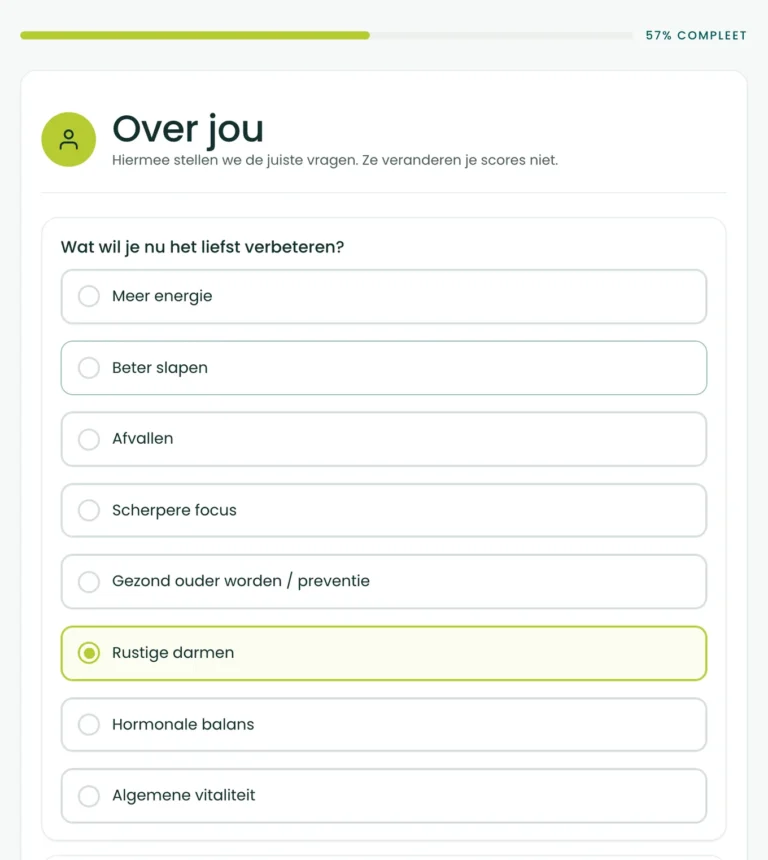
You start with eight short questions about yourself. They do not count towards your score; they make sure we can read the rest properly. One of them you may skip.
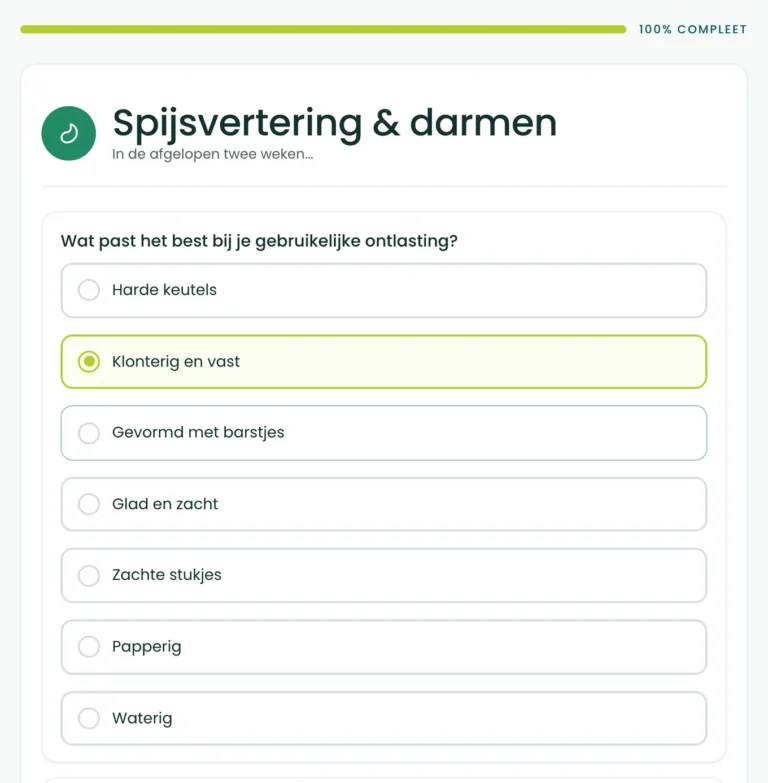
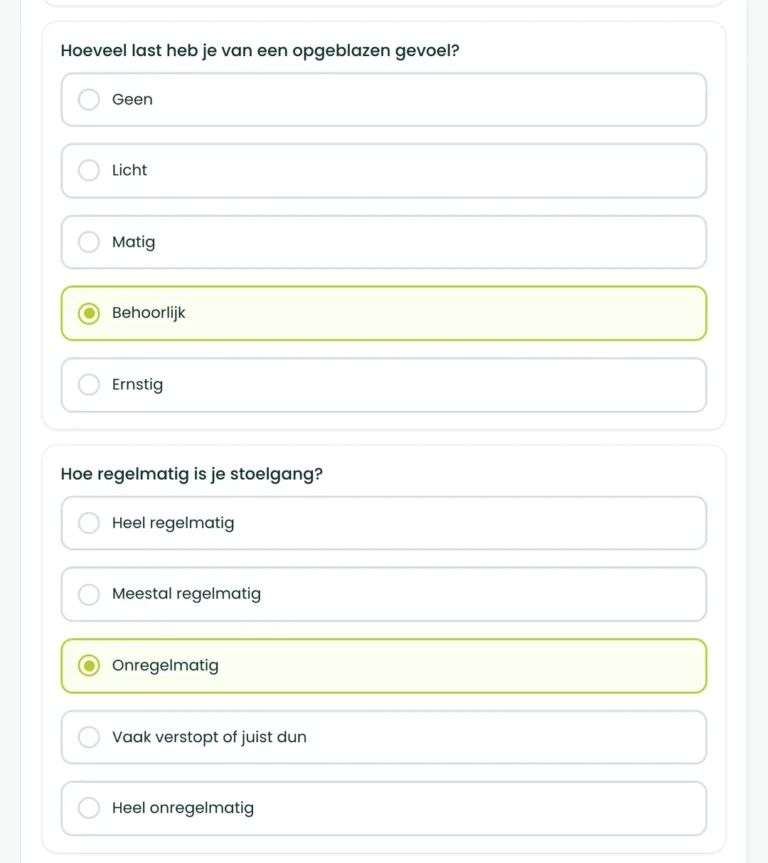
Then come the six gut questions, about the past few weeks: the shape of your stool, abdominal pain or discomfort, a bloated feeling, regularity, reflux or heartburn, and symptoms after certain foods. Every question has five answers; the question about stool shape has seven, the seven types of the scale.
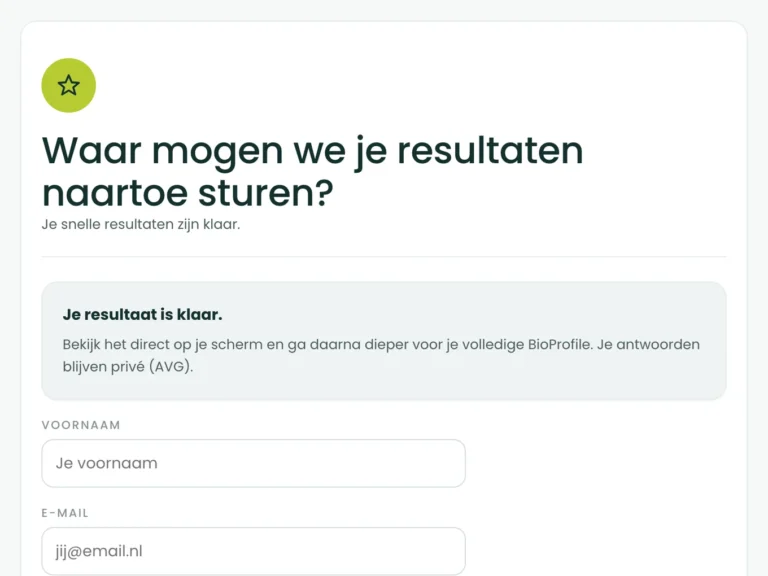
You fill in your first name and email address. You see a first picture right away, and one tap on your dashboard puts your gut score on your screen, with its reading band. Your email holds a login link, so you can find your result again later and extend your scan into your full BioProfile.
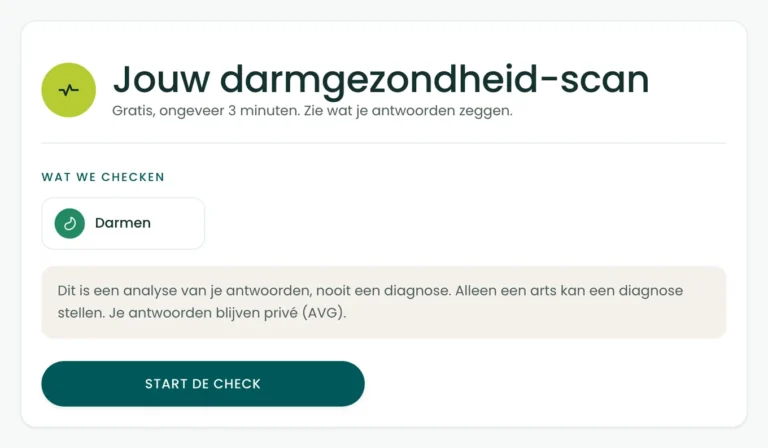
This is what is on your screen after about three minutes:
Repeat the scan in two weeks and you no longer have a feeling about your gut, you have two numbers.
Fill in your first name and email address, and your gut score is in your dashboard.
This scan is about the past few weeks. You get six questions about your gut and your bowel movements, and for each question you pick the answer that comes closest to your ordinary days.
Every question counts towards its own scale. The software then reads your answers back to you question by question, from low to high, so you can see which of the six pulled your score down the most.
The first two cards are the scales the six questions are modelled on: the shape of your stool as a signal of passage, and the symptom clusters. The third card is the description doctors use; we use it only to describe your pattern, and no diagnosis comes out of it: only a doctor can make one.
modelled on
A one-question scale with seven types, validated against measured transit time through the gut. Types 1 to 2 point to slower transit, 3 to 4 to the usual range, 5 to 7 to faster transit. That is why we read your answer about your stools as a transit signal and not as a preference.
Modelled on, not validated as, this instrument.
Validated for: transit time through the gut.
Lewis and Heaton, Scandinavian Journal of Gastroenterology, 1997.
modelled on
A scale of 15 questions with five symptom clusters: reflux, abdominal pain, indigestion, diarrhoea and constipation. We use that cluster structure as a model for which questions we ask and how they group, and we score severity continuously, just as the original does, without a diagnostic band.
Modelled on, not validated as, this instrument.
Validated for: severity of stomach and bowel symptoms.
Svedlund and colleagues, Digestive Diseases and Sciences, 1988.
used descriptively only
The Rome IV criteria are how the field of gastroenterology and hepatology describes the symptom pattern of irritable bowel syndrome: recurring abdominal pain with a change in the frequency or the form of your stool. We use the underlying symptom questions descriptively, to describe your pattern, and never the diagnostic rule, because this is an analysis and not a diagnosis.
Used only descriptively. We do not apply the diagnostic rule behind it here.
Validated for: diagnostic classification of functional bowel disorders.
Rome IV diagnostic criteria for irritable bowel syndrome, Rome Foundation.
Self-reporting gives a valid picture of the symptom burden and the transit pattern of the gut. It cannot establish irritable bowel syndrome or any other bowel disease, and the questions above are written in house and modelled on those instruments instead of being licensed copies of them. So this is a structured, scientifically grounded picture and not a validated clinical score. That is why your reliability reads as average and not as high: only blood or stool testing can lift it.
BioProfile scoring rules, measurement class A, reliability capped at medium on the basis of questionnaire data alone.
Each question gets points from little trouble to a lot of trouble (stool form 0 to 3, the other five 0 to 4), added up and converted into a gut score from 0 to 100. Higher is better.
0 to 39
high symptom burden
40 to 59
noticeable
60 to 79
mild
80 to 100
low burden
Reading bands, not clinical cut-off values. Your gut health questions are written in house and modelled on validated instruments, so no published cut-off value applies to exactly this score. Higher is always healthier.
This scan falls into measurement class A: a questionnaire is the usual way here to measure symptom burden and transit pattern, and still the reliability of your score stays capped at average as long as only your answers count. What lifts that ceiling is blood or stool testing, and you can add that in your full BioProfile.
On your results screen that reliability appears as a label next to your score: medium reliability, symptom based. That label is not an aside; it tells you exactly how much weight you may put on the number.

This page describes a measuring instrument, so below you can read where that instrument comes from and what has been studied about it. Every claim points to the source it appears in.
Sperber and the Rome Foundation surveyed 73,076 adults in 33 countries: over the internet 40.3 per cent met the description of at least one functional stomach or gut complaint, in household interviews 20.7 per cent, women more often than men, and those who met it had a lower quality of life and went to the doctor more often.1 Lovell and Ford pooled 81 studies with 260,960 people: 11.2 per cent have an irritable bowel, women 1.67 times as often.2 In 45 studies with 261,040 people, Suares and Ford found 14 per cent chronic constipation.3 El-Serag lined up the population studies on reflux: in Europe 8.8 to 25.9 per cent, and rising since 1995.4
In the Netherlands, Flik and colleagues showed what it costs: in 326 people seen by a GP, care costs rose by 486 euros a year after irritable bowel had been established, and in 9,274 people seen by a specialist by 2,328 euros.5
One in ten to four in ten, and almost nobody has a number for it. That is the reason this scan exists.
In 1992 Heaton and colleagues questioned 1,897 residents of Bristol and had them keep a record of three bowel movements: once a day was a minority, a regular 24-hour rhythm applied to 40 per cent of the men and 33 per cent of the women, and only 56 per cent of the stools in women and 61 per cent in men were of the type that gives the fewest symptoms. So what looks ordinary is ordinary for fewer than half of people.6
In 1997 Lewis and Heaton showed in 66 volunteers why the form matters: the form of the stool was linked more closely to the measured transit time through the gut than the frequency or the weight was, and it moved along when transit was sped up and slowed down with medicines.7 Blake and colleagues tested the scale in 2016 in 169 healthy people: the types they picked were linked to the water content of the stool, and 81 per cent of the test models were classified correctly.8 That is why the first question of this scan is a picture of seven types, and not a question about how your bowel movements feel.
In 1988 Svedlund and colleagues built the Gastrointestinal Symptom Rating Scale, fifteen questions that order symptoms into clusters, with an agreement between raters of 0.86 to 1.00.9 Our questions two to six follow those clusters in our own words: pain, a bloated feeling, regularity, reflux, and the relation with food. They are not a copy of it, and the card above says so in as many words.
The question about food is there because the answer is nearly always yes: Böhn and colleagues put it to 197 people with an irritable bowel, and 84 per cent named at least one food that gave them symptoms, with dairy (49 per cent), legumes (36 per cent) and apple (28 per cent) at the top; the more severe the symptoms, the more foods.10 Bijkerk and colleagues found, in 142 Dutch patients and 100 GPs, that abdominal pain and bloating were the most bothersome symptoms for both groups, and that patients thought of food where GPs thought of fibre.11
The Rome IV criteria describe how doctors characterise the symptom pattern of an irritable bowel; in 2016 Lacy and colleagues divided the functional bowel complaints into five groups.12,13 This scan uses that description to describe your pattern and never as a rule to establish anything: that is not a diagnosis, and only a doctor can make a diagnosis. Sperber showed how sensitive such a rule is: with the Rome IV criteria 4.1 per cent of the internet respondents met the criteria for an irritable bowel, with the older Rome III criteria 10.1 per cent.1
Ford and colleagues wrote in The Lancet in 2020 how a doctor does it: on the history of your symptoms, with limited testing, unless there are warning signs such as a drop in weight or blood in the stool.14 Mujagic and colleagues in Maastricht only reached a sensitivity of 88 percent with a panel of eight blood and stool markers, and even that was related to the symptom score only moderately.15 A low score means that looking further makes sense, and nothing more. Blood in the stool or your weight dropping without you trying are reasons to see a doctor, and only a doctor can make a diagnosis.
In Böhn, the number of foods that gave symptoms went together with a lower quality of life for sleep, energy, eating and social functioning.10 In Sperber, people with a functional symptom went to the doctor more often and had a poorer quality of life.1 In Flik, costs rose the most for those who went to the specialist, and the researchers argued for the general practitioner as the first step.5
That is a link, not a cause, and that is how those studies put it too. What it does say: a belly that jumps around from day to day is exactly the complaint that needs a number over a few weeks, and exactly the complaint where an honest first step is cheaper than an expensive test.
This is what the scan rests on. Now your gut score.
Fill in your first name and email address, and your gut score is in your dashboard.

This page was written by BioProfile. BioProfile sells health products and this scan is free: no purchase comes with it. The Bristol Stool Form Scale and the Gastrointestinal Symptom Rating Scale are not ours and are not free to use. That is why we ask our own six questions, modelled on those instruments, and nowhere do we call them a validated copy of them.
Every source below was checked on the day this page was published. The numbering follows the text: source 1 is the first one the text refers to, and the three instruments the analysis names sit in between, at the point where they come up.
Six questions, about three minutes, and your gut score is in your dashboard. Your answers stay private (GDPR).
Fill in your first name and email address, and your gut score is in your dashboard.
What this does not say. This is a picture of your symptom burden, not a diagnosis. It cannot tell you whether this is irritable bowel syndrome, an intolerance, coeliac disease, or something that passes on its own, and it does not replace a doctor who looks at you. If you ever see blood in your stool, or your weight drops without you trying, that is a reason to go to a doctor and not a score.
BioProfile analyses your health status to guide you and your coach. It does not make a diagnosis, only a doctor can do that. Built on validated health questionnaires; the combined BioProfile score is not itself a validated clinical instrument yet. Your answers stay private (GDPR).