
BioProfile analysis · metabolism scan
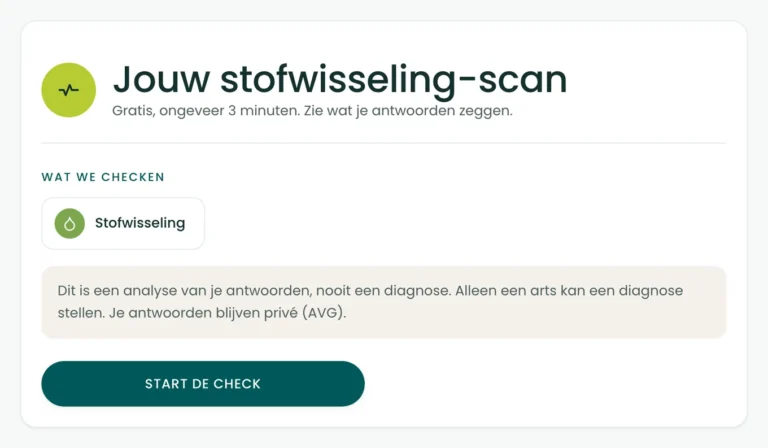
Your result in 3 minutes
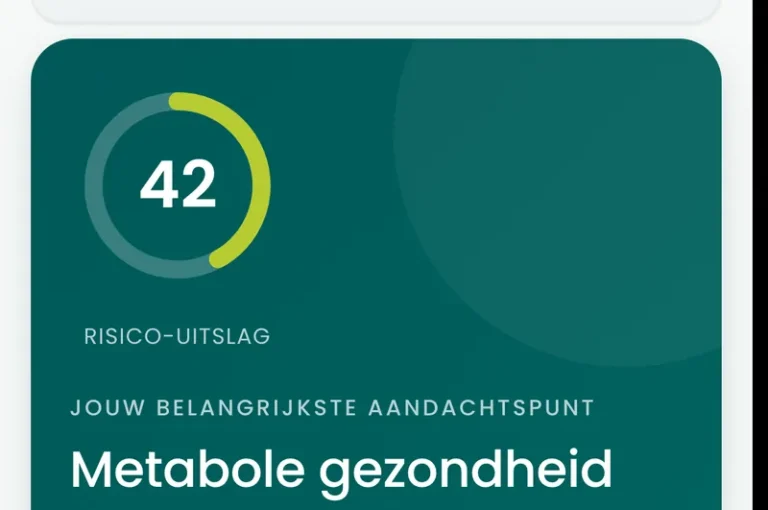
Your risk result, with the reading band it falls into and, per question, the risk points that set the direction. All on your own screen, in your dashboard, with a blood test named alongside it as the next step.
Six questions plus your age, weight and waist, scored the way the published Finnish risk score is scored. You get a risk result from 0 to 100, with the reading band alongside it. A direction of future risk, never a measurement.
Free
6 questions
About 3 minutes
Direction 0 to 100
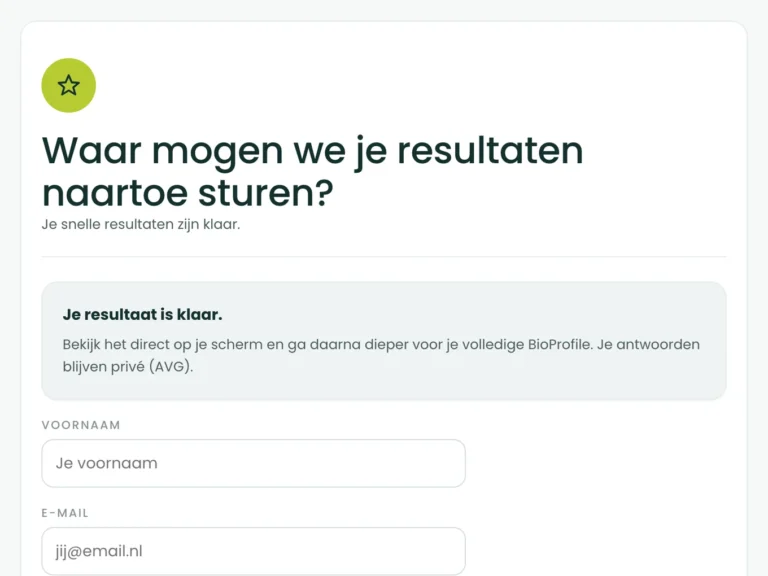
Fill in your first name and email address, and your risk result is in your dashboard.
(and the scientifically grounded reason we ask about your waist right here)
You feel fine. That is exactly the problem. You are a bit heavier than ten years ago, especially around the middle, your mother takes pills for blood sugar, and after lunch you could sleep for an hour. But nothing hurts, so there is nothing to take to a doctor. And somewhere in your head sits the question whether you are heading the same way as your mother.
The hard thing about metabolic disruption is that the first years are silent. Blood sugar and blood fats shift without you noticing, and that is exactly why there is no symptom questionnaire for it: there is nothing honest to ask about. What there is, is a published risk score that estimates the direction of your future risk from what you carry with you and what you do. Not a measurement. A direction. And the online shops that sell you a metabolism test start at the measurement without knowing the direction.
So we do it the other way round. Six questions, plus your age, weight and waist from the first questions, scored the way the Finnish score does it, added up into a risk result from 0 to 100. Not a diagnosis. A direction, yes, and the honest next step if that direction points the wrong way: a blood test.
A month without sugar. A glucose meter from an online shop, a supplement for your blood sugar, a diet with a name. All understandable, and all of them start in the same place: with what you are going to do about it.
So three months later you still do not know where you stood. You recorded nowhere how you moved, what you ate and what you carried when you began, and a risk you do not feel changes without you feeling it too. Without a starting value, every improvement is a feeling about a feeling.
We analyse the real cause first
At BioProfile we turn the order around. First set the direction down with the score that was built for it in Finland and tested worldwide, with the limit stated alongside: a direction, not a measurement, until blood values lie next to it. Only then talk about what you do with it. Analyse first, advise after.
The metabolism scan is the first step of that analysis, and the step that tells you whether a blood test is already worth it.
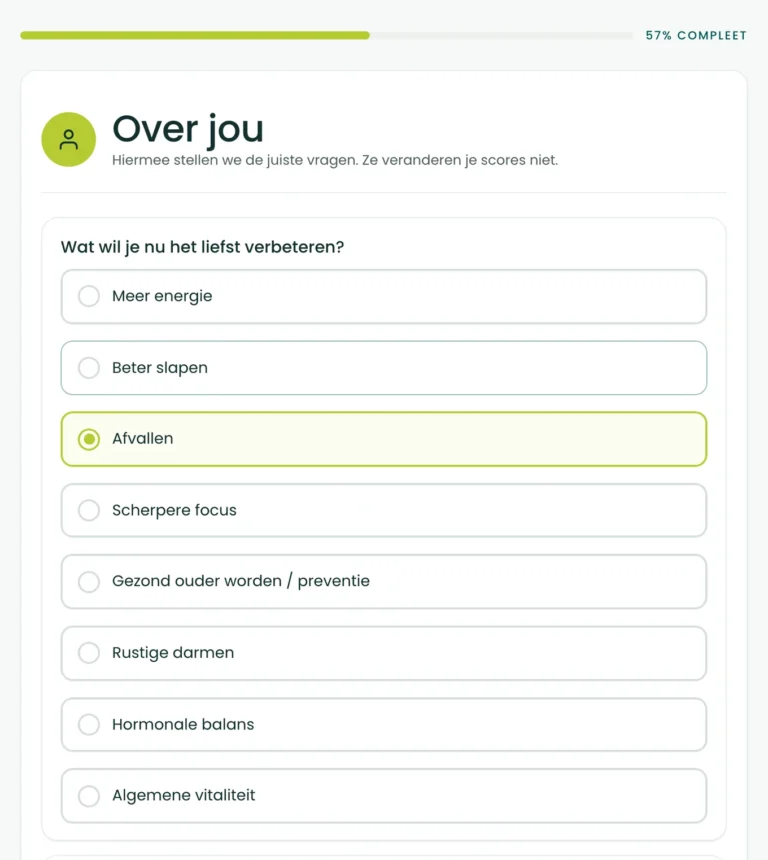
You start with eight short questions about yourself, among them your year of birth, height, weight and waist. Here they do count: the published score gives risk points for them, and so do we. One of them you may skip.
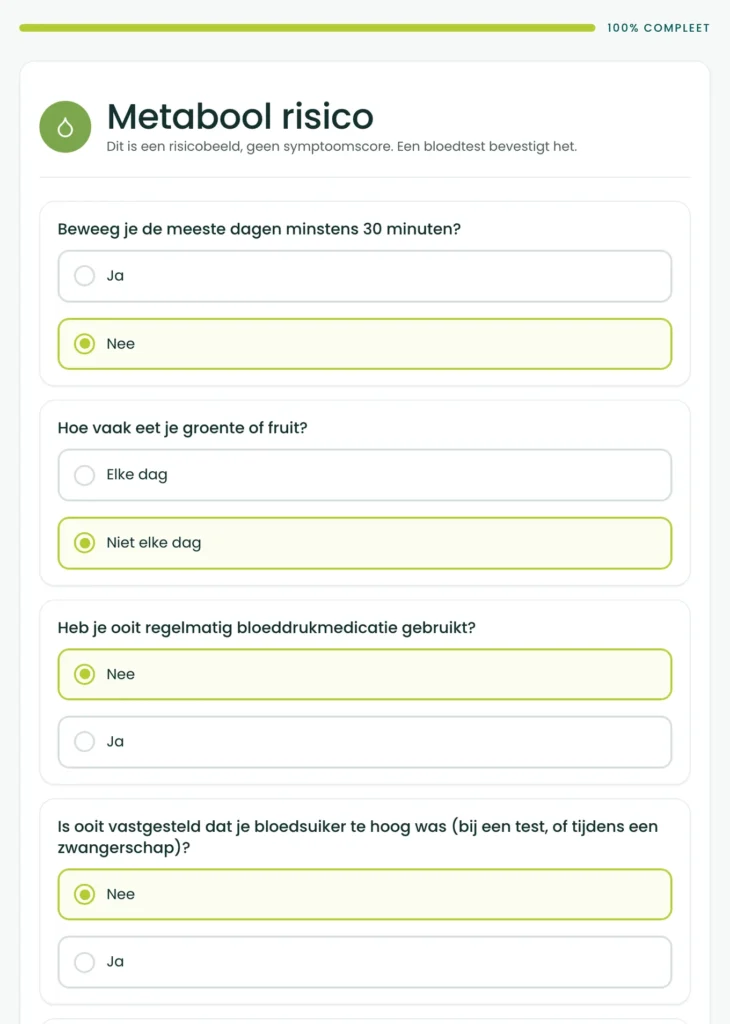
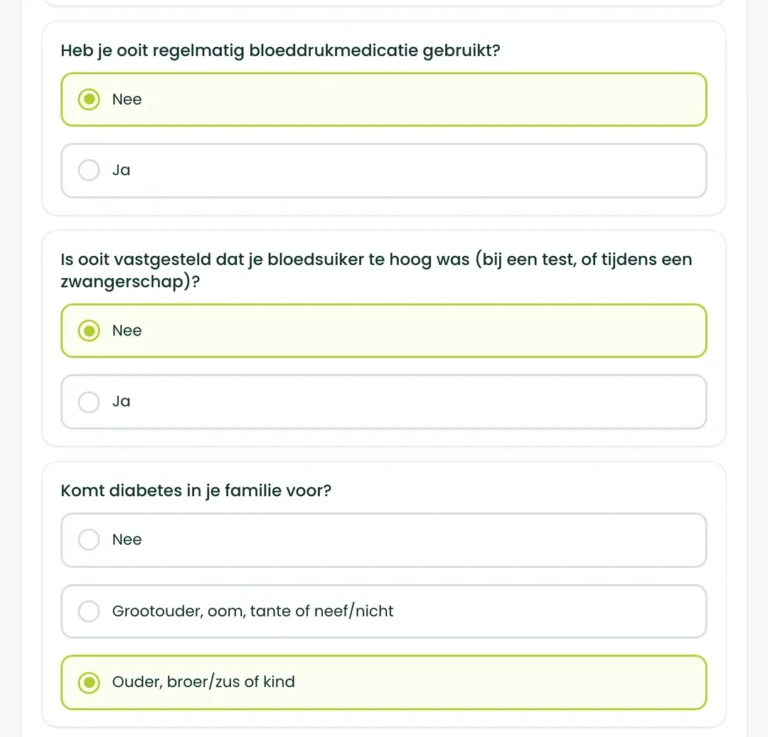
Then come the six questions: thirty minutes of exercise on most days, vegetables or fruit every day, blood pressure medication, high blood sugar in the past, disturbed blood sugar in the family, and cravings for sugar or carbohydrates. Each question has two to five answers.
You fill in your first name and email address. You see a first picture straight away, and one tap on your dashboard puts your risk result on your screen, with the reading band beside it. In your email there is a login link, so you can find your outcome again later and extend your scan with blood values.
This is what is on your screen after about three minutes:
Add blood values later and the direction becomes a score. Until then you no longer have a feeling about your metabolism, but a baseline.
Fill in your first name and email address, and your risk result is in your dashboard.
Six questions about what you do and what you carry with you. Together with your age, body mass index and waist from the first questions, they build your result, the way the published risk score does.
The scan takes both cards over as published: the Finnish risk score as the calculation model, and the waist-to-height ratio from your first questions. Hence the badge: used word for word, and no questions of our own modelled on an instrument.
used word for word
Eight questions without laboratory values, scored from 0 to 26, that predict the ten-year risk of type 2 diabetes with an accuracy of around 0.70 to 0.75, in bands: 0 to 6 low, 7 to 11 slightly raised, 12 to 14 moderate, 15 to 20 high, 21 to 26 very high. It uses your age, body mass index, waist, exercise, diet, blood pressure medication, glucose history and family history. It estimates the direction of future risk, not your current metabolic state.
Used as published, word for word.
Validated for: ten-year risk of developing type 2 diabetes.
used word for word
A freely available measure that you can take yourself at home, where a ratio of 0.5 or higher points to belly fat that deserves attention. That is why we ask about your waist and not only your weight: where the fat sits predicts metabolic risk better than how much you weigh.
Used as published, word for word.
Validated for: screening for abdominal fat and cardiometabolic risk.
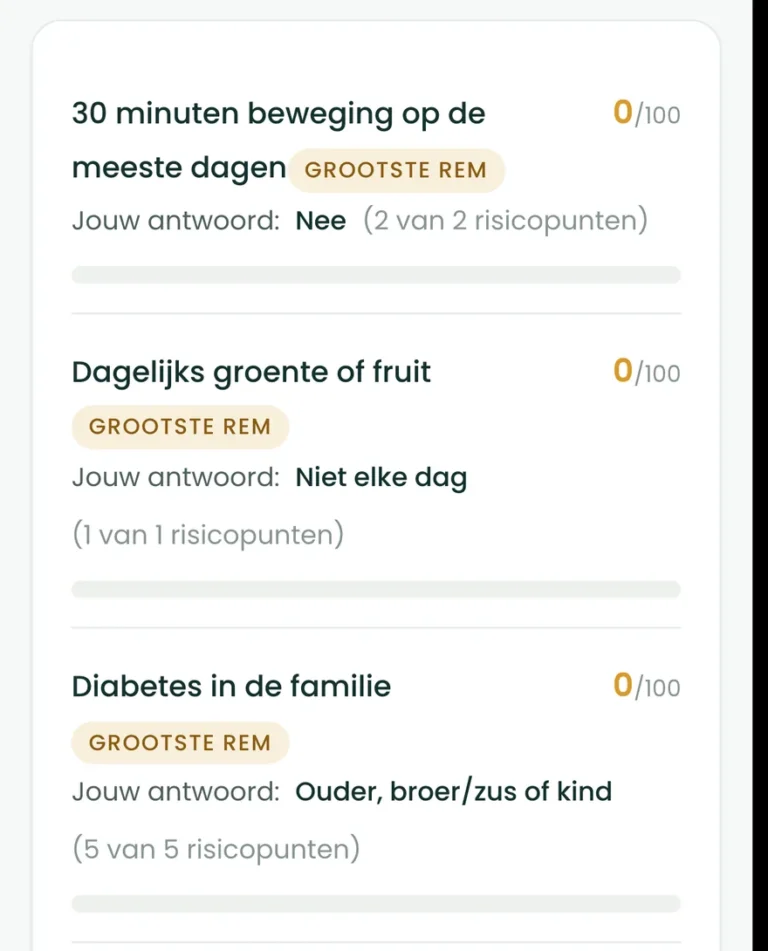
This result uses more than just the questions above. Your age, your body mass index and your waist measurement carry risk points too, exactly as the published risk score does, and that is why the rows below do not add up to the whole result on their own.
There is no validated symptom questionnaire for metabolic health, because early metabolic disruption causes no symptoms. What self-reporting can honestly do is estimate the direction of future risk from what you carry with you and what you do, and that is exactly what the published risk score was built for. It cannot measure your current metabolic state and cannot establish anything. That is why this area, on answers alone, is capped at low reliability, and why a blood test lifts it, not a better questionnaire.
BioProfile scoring rules, measurement class D, risk basis, confidence capped at low on the basis of questionnaire data alone.
The result follows the published risk score: your age, body mass index and waist from the first questions all count, plus the questions here, each with its own risk points. The points are added up and converted into a risk result from 0 to 100, so the rows on your screen do not add up to the whole on their own. Higher is better, and it is a direction, not a measurement.
0 to 39
high risk signal
40 to 59
elevated risk signal
60 to 79
limited risk signal
80 to 100
low risk signal
Reading bands, not clinical cut-off values. Your metabolic health questions are written in house and modelled on validated instruments, so no published cut-off value applies to exactly this score. Higher is always healthier.
This scan falls into measurement class D: early metabolic disruption causes no symptoms, so on answers alone the reliability stays low, and it says so; feeling well does not lift it. What lifts it is a blood test, fasting glucose and HbA1c, and you can add that in your full BioProfile; only then does a direction become a score.
On your result screen that reliability stands as a label next to your result: low signal, risk indicator. That label is not a side note; it says exactly how much weight you may hang on the number.
This page describes a measuring instrument, so below you can read where that instrument comes from and what has been studied about it. Every claim points to the source it appears in.
Araújo and colleagues laid the American health measurements from 2009 to 2016 next to the newest guidelines, in 8,721 adults: only 12.2 per cent had a waist circumference, blood sugar, blood pressure, blood fats and HDL cholesterol that were all in order without medication, and even among the people of a normal weight less than a third.1 Tabák and colleagues described the stage before it in 2012: every year 5 to 10 per cent of the people with a slightly raised blood sugar move on to the condition, and as many move back again, and the disturbance begins before blood sugar visibly changes.2
Silent, then. No pain, no symptom, and so no symptom questionnaire either. That is why this scan asks what you do and what you carry with you, and not how you feel.
Lindström and Tuomilehto built the Finnish risk score in 2003 on a population sample of 4435 people aged 35 to 64, followed for ten years: age, body mass index, waist, blood pressure medication, a high blood sugar in the past, exercise and vegetables or fruit every day, added up to 0 to 20 points; at 9 points or more the score caught 78 per cent of the later cases, with a specificity of 77 per cent.3,4 In 2005 Saaristo and colleagues tested it in 2966 Finns with a glucose tolerance test: an accuracy of 0.72 in men and 0.73 in women for cases not yet discovered.5
In 2011 Noble and colleagues counted 145 risk models, tested in 6.88 million people: most are rarely used because they ask for blood values or were built with no user in mind.6 The Finnish score asks for no blood value at all, and that is exactly why this scan takes it over as it was published, and says that it gives a direction.
The six questions are the questions of the Finnish score, in our own words where a screen needed that, and the score counts the way the score counts: age, body mass index and waist from your first questions carry risk points, so the rows on your screen together are not the whole number.4 The InterAct study followed 340,234 people in eight European countries: waist circumference predicted the risk independently of body mass index, more strongly in women, and among people with overweight a large waist circumference marked out a group with the same risk as people with obesity.7
Ashwell pooled 31 studies with more than 300,000 adults: waist divided by height picks up metabolic and heart risk better than waist circumference and BMI, with a cut-off of 0.5.8,9 The international organisations that aligned the criteria for the metabolic risk profile in 2009 kept the waist measurement as the first sieve.10 That is why this scan asks about your waist, and not only about your weight.
A low risk result means the direction is unfavourable: risk points from what you carry with you and what you do. It is not a measurement of your current metabolism and not a diagnosis, and we say so in as many words on the card above. Feeling well does not lift it, because early change is silent.
What a low result does mean is that a blood test is worth it: fasting glucose and HbA1c are the values that turn a direction into a score. Only a doctor can make a diagnosis.
In 2001 Tuomilehto and colleagues randomised 522 Finns with impaired glucose tolerance between coaching on weight, fat, fibre and physical activity and usual care: after four years 11 per cent of the coached group had developed the condition against 23 per cent, a reduction of 58 per cent.11 In 2002 Knowler and colleagues found the same figure, 58 per cent, in 3,234 Americans, and the lifestyle coaching worked better than the medicine.12 In 2018 Lean and colleagues showed that it can turn even with a condition already diagnosed: in 46 per cent of 149 people who started an intensive weight programme, blood sugar was normal again after a year without medication, against 4 per cent in the control group.13
In 2014 Ley and colleagues summed up what counts on the plate: the quality of fats and carbohydrates more than the quantity, more wholegrain, vegetables, fruit, pulses and nuts, less refined grain, processed meat and sugary drinks.14 That is research in people at high risk and it promises nothing about you. What it does say: of all the directions this scan can point, this one is the most reversible, and that starts with knowing which way you are heading.
This is what the scan stands on. Now your direction.
Fill in your first name and email address, and your risk result is in your dashboard.

This page was written by BioProfile. BioProfile sells health products and this scan is free: no purchase comes with it. The Finnish risk score and the waist-to-height ratio are not ours; we take them over as published and change not a word of them. And we do not measure your metabolism: only blood can do that.
Every source below was checked on the day this page was published. The numbering follows the text: source 1 is the first one the text refers to, and the two instruments the analysis names sit in between, at the point where they come up.
Six questions, about three minutes, and your risk result is in your dashboard. Your answers stay private (GDPR).
Fill in your first name and email address, and your risk result is in your dashboard.
What this does not say. This estimates the direction of future risk, not your current metabolic state, and it is not a diagnosis of diabetes or metabolic syndrome. For that you need fasting glucose, HbA1c, blood fats and blood pressure. It also cannot be lifted by feeling well, because early metabolic change is silent by nature. Upload a result and this is no longer a signal but a real, ranked score.
BioProfile analyses your health status to guide you and your coach. It does not make a diagnosis, only a doctor can do that. Built on validated health questionnaires; the combined BioProfile score is not itself a validated clinical instrument yet. Your answers stay private (GDPR).