
BioProfile analysis · sleep scan
Your result in 3 minutes
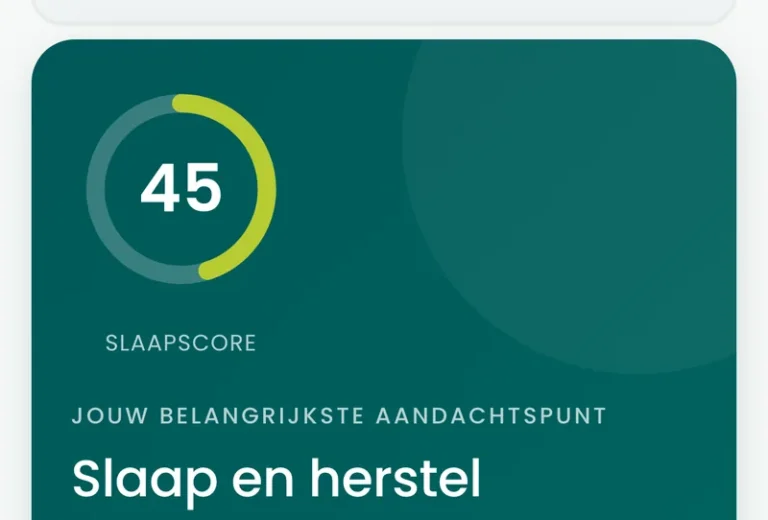
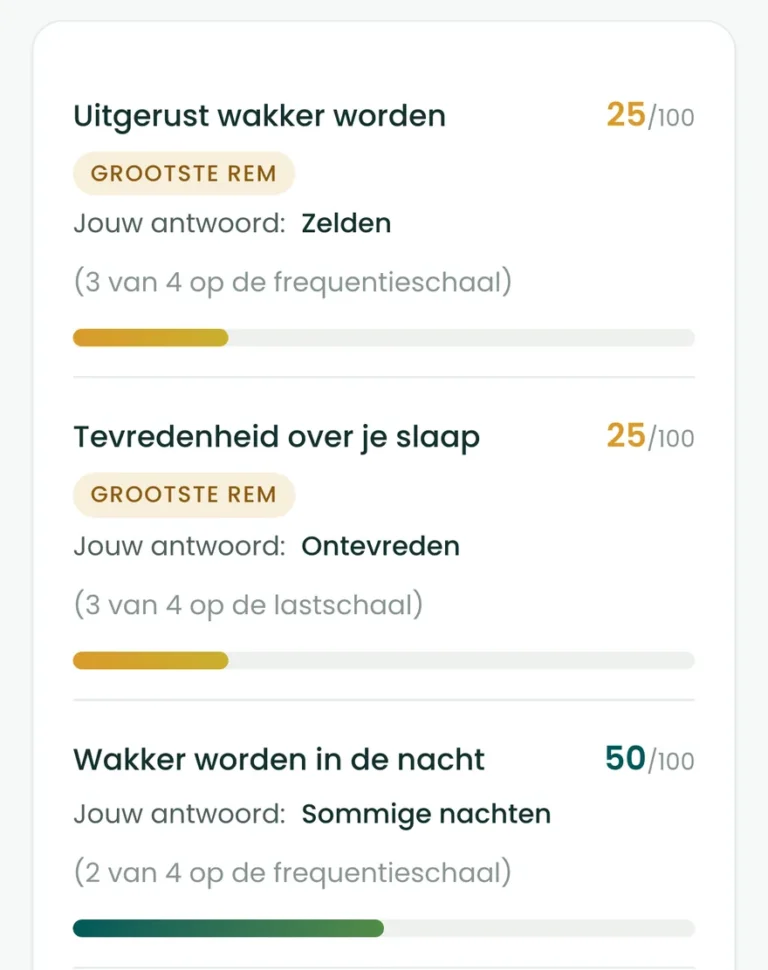
Your sleep score over the past two weeks, with the reading band it falls into and, question by question, the number that pulled your score down or up. All on your own screen, in your dashboard.
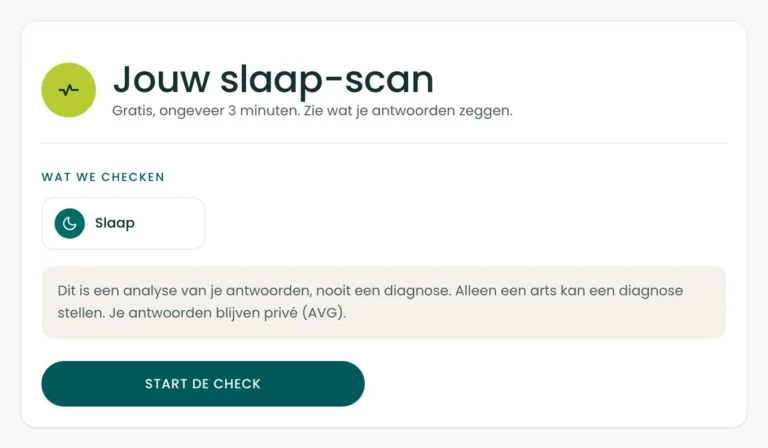
Five questions about the past two weeks, modelled on a validated insomnia scale. You get a sleep score from 0 to 100, with the reading band it falls into. An analysis of your answers, never a diagnosis.
Free
5 questions
About 3 minutes
Score from 0 to 100
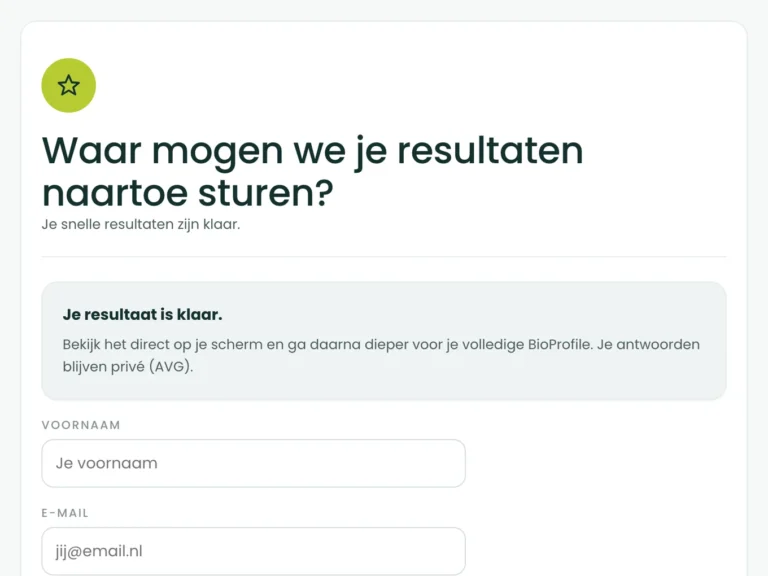
Fill in your first name and email address, and your sleep score is in your dashboard.
(and the scientifically supported reason why it is precisely these five)
You go to bed on time. You get your hours in, mostly. And still the alarm is a blow every morning: you struggle to get going, the first coffee does little, and halfway through the afternoon you are nodding off over your screen. You are not ill. You simply do not wake up rested.
The awkward thing about sleep is that you are not there for it yourself. How you feel during the day you know exactly; what happened during the night you have to reconstruct. And that is precisely where your memory lets you down: a bad night you remember, ten ordinary nights you forget, and how long you really lay awake is something no one knows who has to guess at it. So it stays a feeling about a night, and a feeling about a night is not a measurement.
Sleep researchers solved that by asking about a pattern instead of about one night: how long you take to fall asleep, how often you wake up, how rested you get up, how satisfied you are, and what it costs you during the day. Five questions about two weeks, added up into a score from 0 to 100. Not a diagnosis. But a number. And a number is something you can follow.
To bed earlier. No screens after ten. A new mattress, a sleep app, two weeks without coffee. All sensible, and all of them start in the same place: with what you are going to do about it.
So after three weeks you still do not know whether it did anything. You never wrote down where you started, and sleep is exactly the area where your memory helps you least. Without a starting value, every change is a feeling about a feeling.
We analyse the real cause first
At BioProfile we turn the order around. First measure what is there now, with questions modelled on a scale someone else has validated, and only then talk about what you do with it. Analyse first, advise after.
The sleep scan is the first step of that analysis, and one of the shortest.
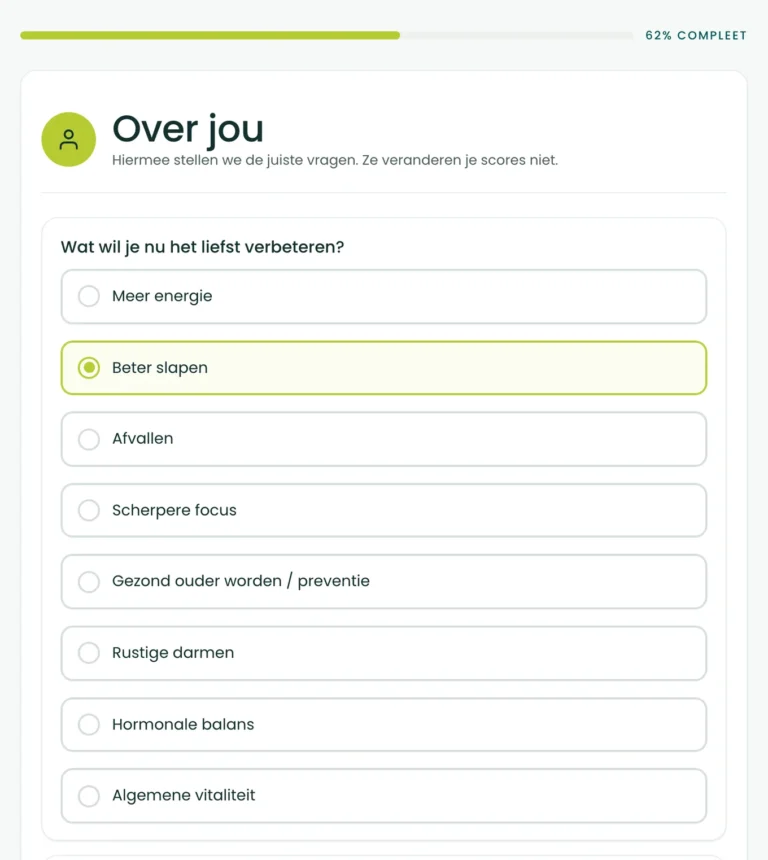
You start with eight short questions about yourself. They do not count towards your score; they make sure we can read the rest properly. One of them you may skip.
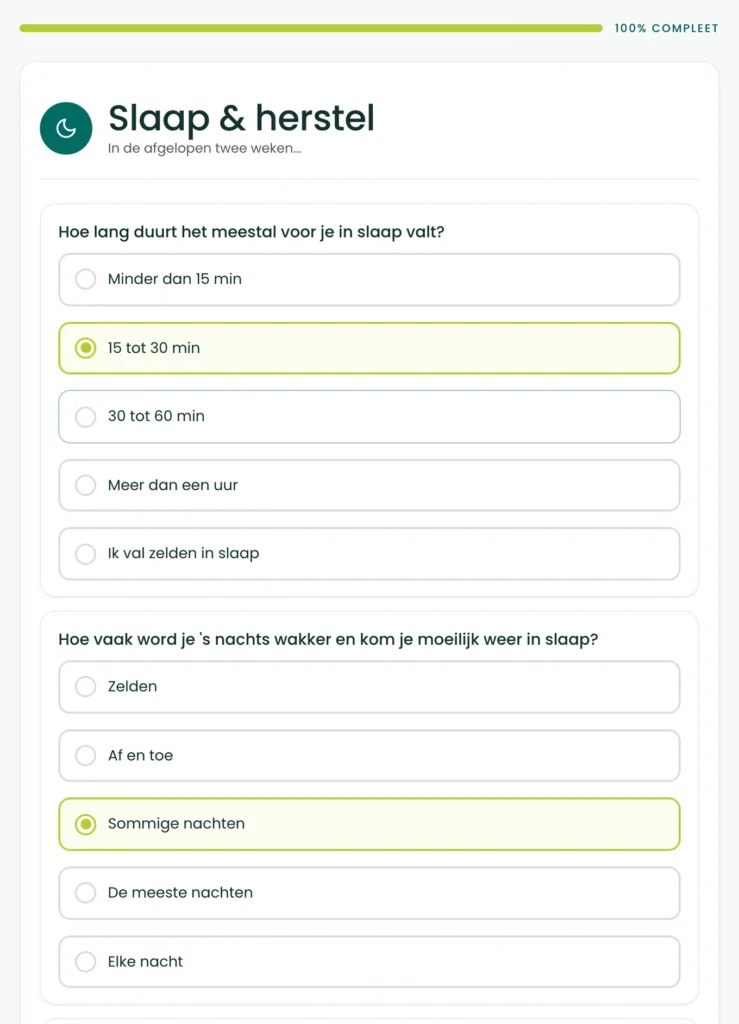
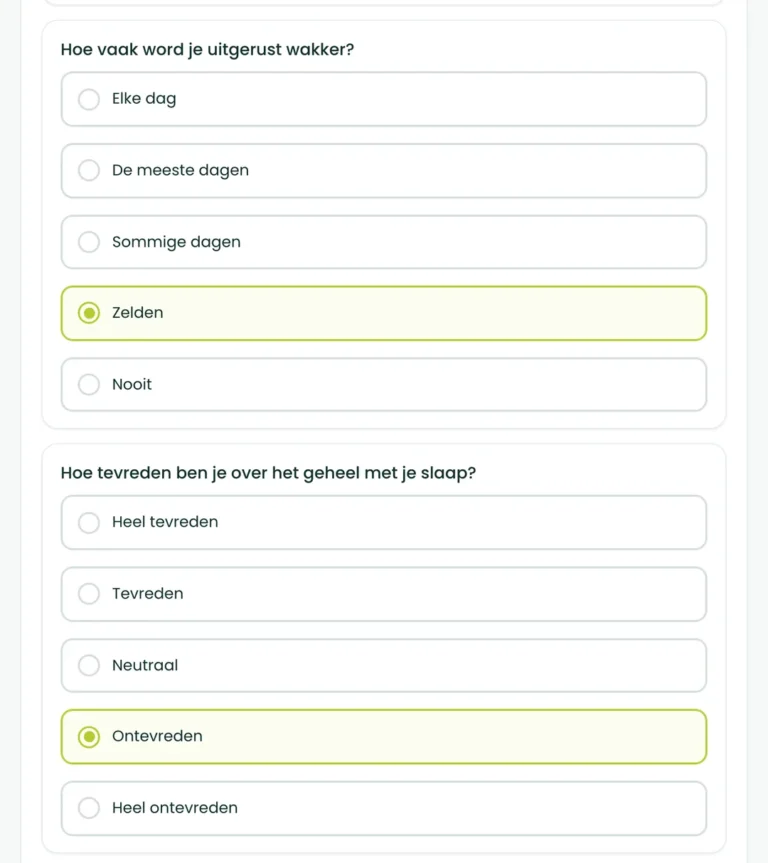
Then come the five sleep questions, about the past two weeks: how long you take to fall asleep, how often you wake up at night, how often you get up rested, how satisfied you are with your sleep, and how much poor sleep bothers you during the day. Each question has five answers.
You fill in your first name and email address. You see a first picture straight away, and with a tap on your dashboard your sleep score is there on your screen, with the reading band alongside it. In your email there is a login link, so you can find your result again later and extend your scan into your full BioProfile.
This is what is on your screen after about three minutes:
Repeat the scan in two weeks and you no longer have a feeling about your nights, but two numbers.
Fill in your first name and email address, and your sleep score is in your dashboard.
This scan is about the past two weeks. You get five questions about your sleep, and for each one you pick the answer that comes closest to your nights.
Every question counts equally. The software then reads your answers back to you question by question, from low to high, so you can see which of the five pulled your score down the most.
modelled on
Seven questions about the last two weeks, scored from 0 to 28, with a screening cut-off from 10 in the general population (sensitivity 86 per cent, specificity 88 per cent) and an internal consistency around 0.90. Our sleep questions follow the same construct and the same two week look back: how long you take to fall asleep, waking up during the night, how rested the night was, satisfaction, and what it costs you during the day.
Modelled on, not validated as, this instrument.
Validated for: severity of insomnia complaints and treatment response.
Self-report is a valid way to show the burden of sleep quality and insomnia symptoms. It cannot establish a sleep disorder, and the questions above are worded by us and modelled on a validated insomnia scale instead of being a licensed copy of it. So this is a structured, scientifically grounded picture and not a validated clinical score. That is also why your reliability reads medium and not high: only sleep data from a wearable or a sleep study can lift it.
BioProfile scoring rules, measurement class A, reliability capped at medium on the basis of questionnaire data alone.
Each of the five questions is given 0 to 4 points, from little trouble to a lot of trouble. The points are added up and converted into a sleep score from 0 to 100. Higher is better.
0 to 39
high symptom burden
40 to 59
noticeable
60 to 79
mild
80 to 100
low burden
Reading bands, not clinical cut-off values. Your questions about sleep and recovery are worded in house and modelled on validated instruments, so no published cut-off value applies to precisely this score. Higher is always healthier.
This scan falls into measurement class A: a questionnaire is the usual way of measuring here, and even so the reliability of your score stays capped at average as long as only your answers count. What lifts that ceiling is sleep data from a wearable or a sleep study, and you can add a wearable in your full BioProfile.
On your results screen that reliability appears as a label next to your score: medium reliability, symptom based. That label is not an aside; it tells you exactly how much weight you may put on the number.
This page describes a measuring instrument, so below you can read where that instrument comes from and what has been studied about it. Every claim points to the source it appears in.
In 2012 Kerkhof put a validated sleep questionnaire to a nationally representative sample of 2,089 Dutch people between 18 and 70. More than three in ten reported a general sleep disturbance, more than four in ten too little sleep, and 8 per cent met the description of insomnia.1
That picture is not a Dutch one. In 2002 Ohayon brought together more than fifty population studies: about a third of the population has at least one insomnia complaint, in 9 to 15 percent it also has consequences during the day, and about 6 percent meets the strictest description of insomnia.2 In 2021 Van Someren called insomnia the second most common mental disorder.3
Three in ten, and hardly anyone has a number for it. That is the reason this scan exists.
In 2012 Harvey and Tang set out the research on how sleep is perceived. People with sleep complaints systematically overestimate how long they lie awake and underestimate how much they actually sleep, compared with objective measurements. That tendency is almost general, although it is not universal.4
That is why no serious sleep instrument asks about one night. In 1989 Buysse and colleagues built the Pittsburgh Sleep Quality Index around one month and seven components, from time taken to fall asleep to daytime functioning, and showed that structured self-reporting of this kind tells good sleepers from poor ones.5 The questions in this scan follow the same thought: a pattern over two weeks, split into the components that matter.
Morin’s Insomnia Severity Index counts seven questions about the past two weeks. In 2011 Morin and colleagues tested it in 959 people from the general population and 183 people in treatment: internal consistency was 0.90 and 0.91, and the score told insomnia from healthy sleep with a published cut-off value.6 In 2001 Bastien and colleagues had already shown that the scale moves with sleep diaries and with sleep studies, and that it picks up change after treatment.7
Gagnon and colleagues repeated that in 2013 with 410 patients in general practice, with an internal consistency of 0.92.8 And because you fill in this scan online: in 2011 Thorndike and colleagues compared the online version with paper and found an agreement of 0.98 or higher.9
Our five questions follow the construct and the look-back period of that scale, in our own words. They are not a copy of it, and the card above says so in as many words.
The European guideline for insomnia, updated in 2023 by Riemann and colleagues, puts questionnaires and sleep diaries at the front of the examination by a doctor, alongside the conversation itself. A sleep study in the laboratory is there to pick up other sleep problems when there is reason for it, such as pauses in your breathing during sleep.10 In 2013 Buysse described the same order in JAMA: what a doctor establishes follows from the history and a sleep diary, and insomnia affects an estimated 10 to 20 percent of people, in about half of them long term.11
So a questionnaire is a good first sieve, and a first sieve is something other than a result. A low score means that looking further is worthwhile, and nothing more. Loud snoring with pauses in breathing, or falling asleep unintentionally during the day, are reasons to see a doctor, and only a doctor can make a diagnosis.
In 2011, Baglioni and colleagues pooled twenty-one long-running population studies: people with insomnia were twice as likely as people who slept well to develop low-mood complaints later.12 In 2019, Hertenstein and colleagues extended this to thirteen studies and found a raised risk of low-mood complaints, anxiety complaints and problematic alcohol use.13
In 2010 Cappuccio and colleagues followed almost 1.4 million people across sixteen studies: both short and long sleep were associated with higher mortality, short sleep with 12 percent more, long sleep with 30 percent more.14 In 2011 Kessler and colleagues worked out among 7,428 working people what insomnia costs at work: the equivalent of a good eleven days of lost work performance per person per year.15 In 2015 the American sleep societies reached a consensus of seven hours or more a night for adults.16
That is association, not cause, and that is how those studies put it too. What it does say: sleep is not the soft part of health that you look at some other time.
That is what the scan rests on. Now for your sleep score.
Fill in your first name and email address, and your sleep score is in your dashboard.

This page was written by BioProfile. BioProfile sells health products and this scan is free: no purchase comes with it. The Insomnia Severity Index is not ours and is not free to use. That is why we ask our own five questions, modelled on that instrument, and nowhere do we call them a validated copy of it.
Every source below was checked on the day this page was published. The numbering follows the text: source 1 is the first one the text refers to, and the instrument the scan is built on sits among them at the point where it comes up.
Five questions, about three minutes, and your sleep score is in your dashboard. Your answers stay private (GDPR).
Fill in your first name and email address, and your sleep score is in your dashboard.
What this does not say. This reads the sleep burden you describe, not the cause of it. It cannot tell you whether something is physically disturbing your sleep, for example breathing, pain or hormonal changes, and it is not a sleep study. Loud snoring with pauses in breathing, or falling asleep during the day without meaning to, are reasons to see a doctor and not reasons to work on a score.
BioProfile analyses your health status to guide you and your coach. It does not make a diagnosis, only a doctor can do that. Built on validated health questionnaires; the combined BioProfile score is not itself a validated clinical instrument yet. Your answers stay private (GDPR).