
BioProfile analysis · energy scan
Your result in 3 minutes
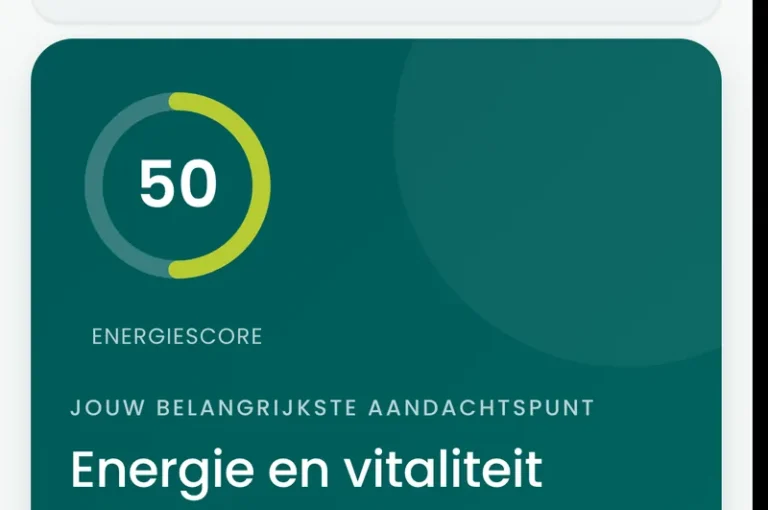
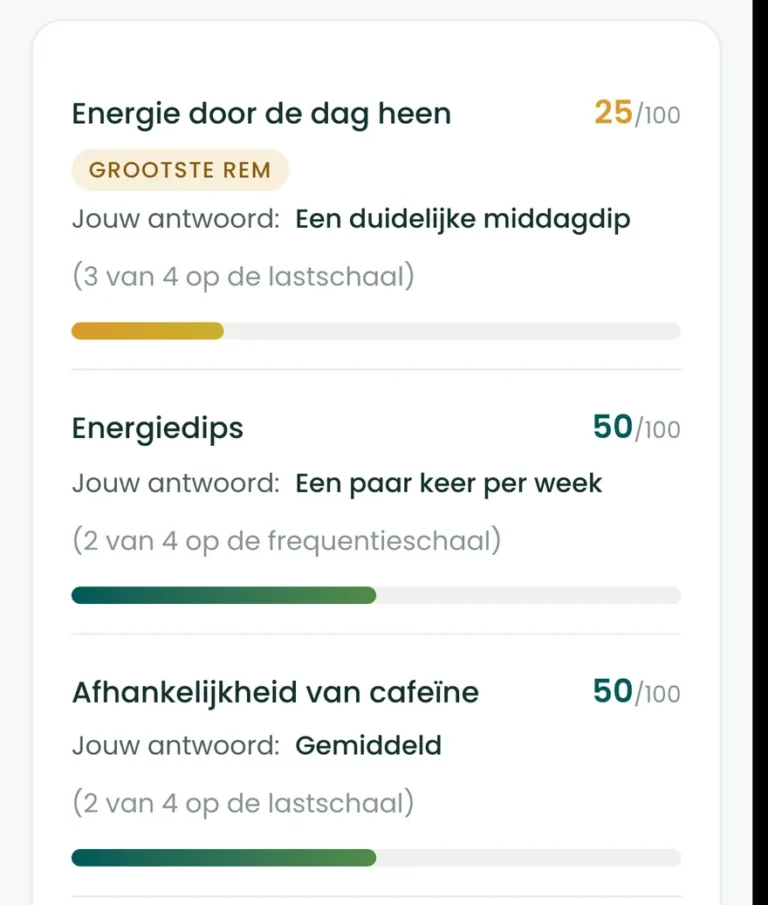
Your energy score over the past two weeks, with the reading band it falls in and, for each question, the number that pulled your score down or up. All on your own screen, in your dashboard, and again in two weeks.
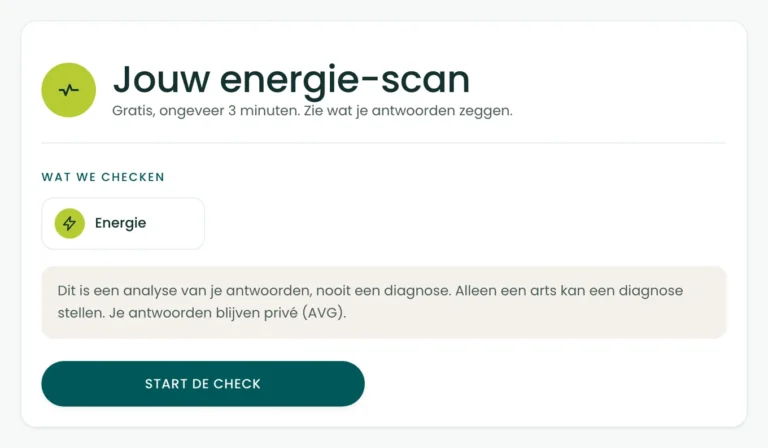
Five questions about the past two weeks, modelled on a validated Dutch fatigue scale. You get an energy score from 0 to 100, with the reading band alongside it. An analysis of your answers, never a diagnosis.
Free
5 questions
About 3 minutes
Score from 0 to 100
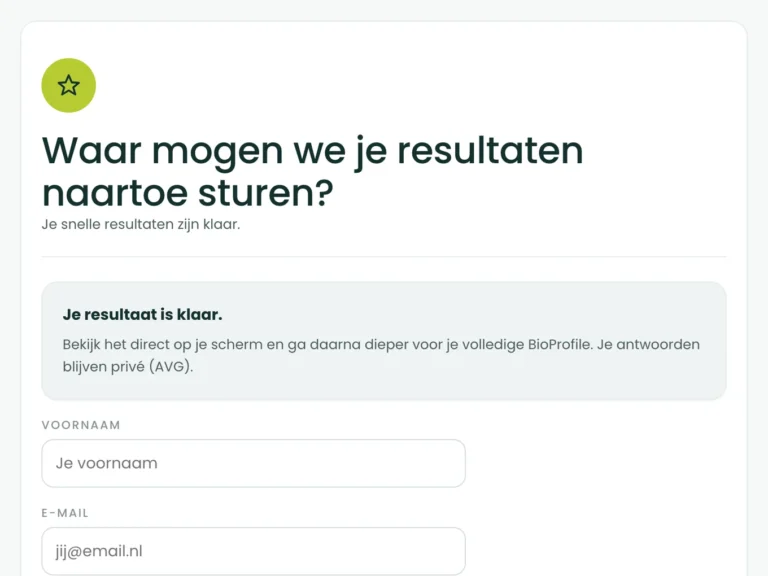
Fill in your first name and email address, and your energy score is in your dashboard.
(and the scientifically supported reason why it is precisely these five)
The morning is still all right. By midday it sinks, at three o’clock you are staring at a screen with your third coffee, and in the evening the sofa is the most you can manage. Exercise was on the plan; the plan never wins against the sofa. You are not ill. You are just tired, a little every day, and it adds up.
The hard part about being tired is that everyone is. Say it to a friend and you get a pat on the back, say it to a GP and you get a questioning look, because tired is not a complaint, tired is the weather. And so you compare yourself with yesterday, and yesterday you were tired too, and that makes today normal. Without a yardstick, every day is normal.
Researchers who did want to measure fatigue did so with a pattern instead of a day: how your energy runs through the day, how often it dips, how much you lean on caffeine, how quickly your body tires, and how often you are too spent to do anything. Five questions over two weeks, added up into a score from 0 to 100. Not a diagnosis. But a number. And a number you can follow.
A jar of vitamins. A juice cleanse. An earlier bedtime, a different coffee, a supplement a colleague recommended. All understandable, and all of them start in the same place: with what you are going to do about it.
So after three weeks you still do not know whether it did anything. You have not written down anywhere how tired you were when you started, and fatigue is precisely the feeling that becomes normal again every day. Without a starting value, every change is a feeling about a feeling.
We analyse the real cause first
At BioProfile we turn the order around. First measure what is there now, with questions modelled on a scale someone else has validated, and only then talk about what you do with it. Analyse first, advise after.
The energy scan is the first step of that analysis, and one of the shortest.
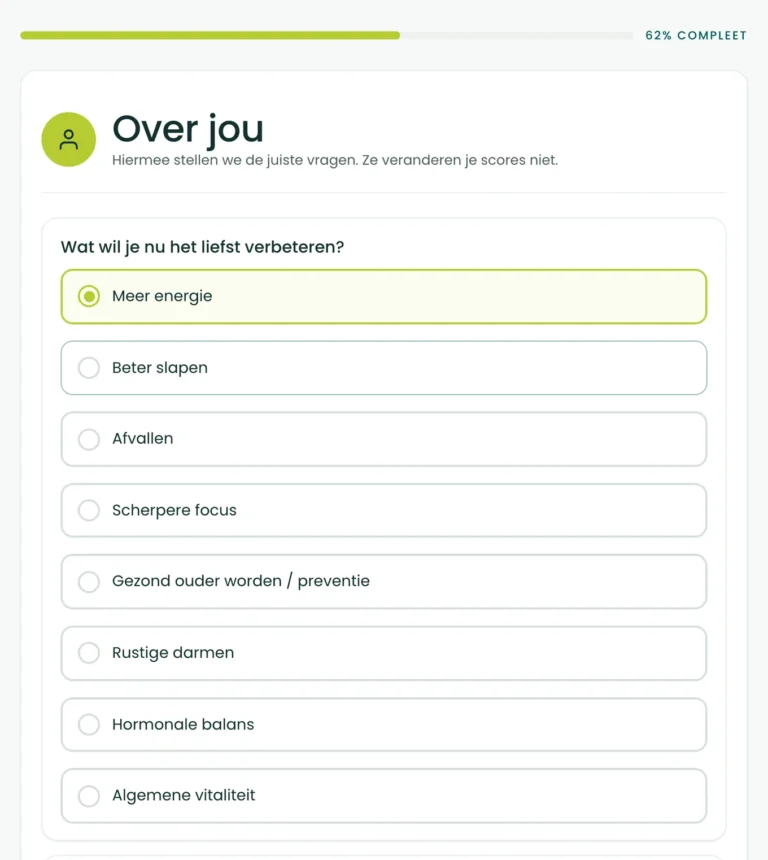
You start with eight short questions about yourself. They do not count towards your score; they make sure we can read the rest properly. One of them you may skip.
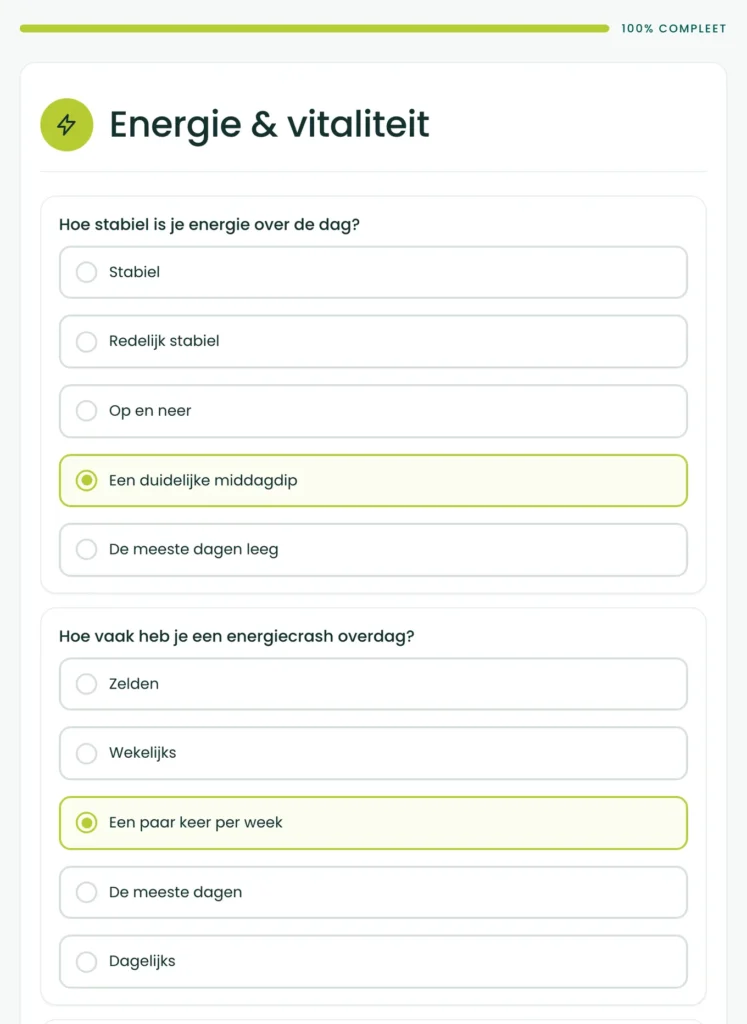
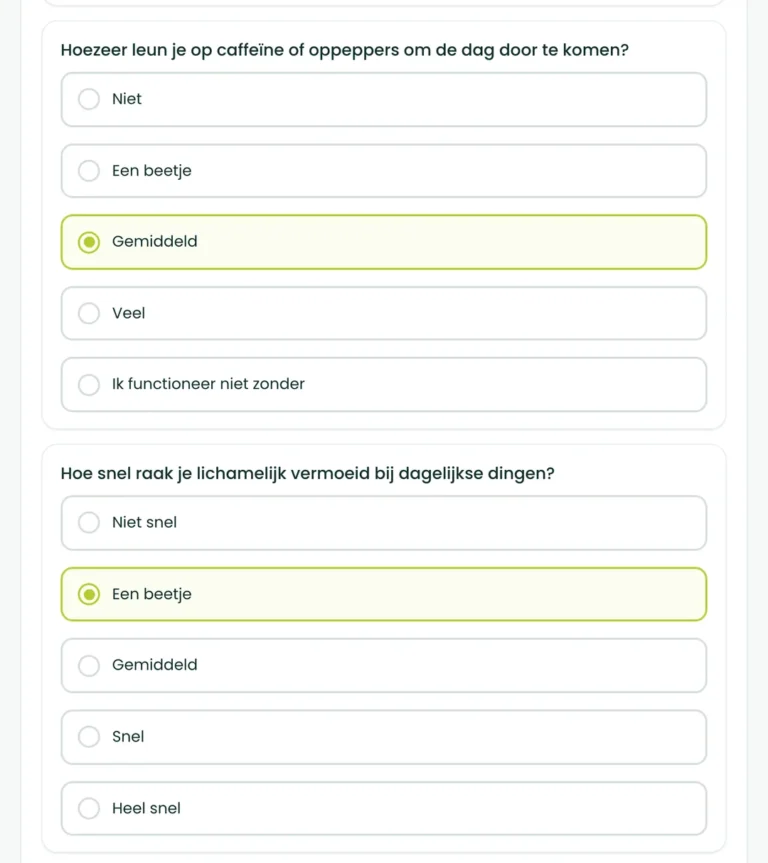
Then come the five energy questions, about the past two weeks: how your energy runs through the day, how often you have a dip, how much you lean on caffeine, how quickly you get physically tired, and how often you are too worn out to do things. Each question has five answers.
You fill in your first name and email address. You see a first picture straight away, and one tap on your dashboard puts your energy score on your screen, with the reading band beside it. Your email holds a login link, so you can find your result again later and extend your scan into your full BioProfile.
This is what is on your screen after about three minutes:
Repeat the scan in two weeks and you no longer have a feeling about your energy, you have two numbers.
Fill in your first name and email address, and your energy score is in your dashboard.
This scan is about the past two weeks. You get five questions about your energy and for each question you pick the answer that comes closest to your days.
Every question counts equally. The software then reads your answers back to you question by question, from low to high, so you can see which of the five pulled your score down the most.
modelled on
Ten questions, scored from 10 to 50, where 22 or higher points to substantial fatigue, with an internal consistency of 0.87 to 0.90 and norms that include working adults as well, instead of patients only. The scale was originally written in Dutch, and that is why it is our model for the Dutch market. Our energy questions follow the same one-dimensional construct.
Modelled on, not validated as, this instrument.
Validated for: fatigue burden in working adults and patients.
Self-reporting gives a valid picture of how much fatigue you carry with you, and that is what the published scale measures. It cannot attribute that fatigue to anything: not to your thyroid, iron, blood sugar, sleep quality or mood. Our questions are written in our own words and modelled on the validated scale rather than being a licensed copy of it. Blood values and sleep data from a wearable are the layers that take this from a picture of the burden to a picture that explains it.
BioProfile scoring rules, measurement class A, reliability capped at medium on the basis of questionnaire data alone.
Each of the five questions gets 0 to 4 points, from little burden to a lot of burden. The points are added up and converted into an energy score from 0 to 100. Higher is better.
0 to 39
high fatigue burden
40 to 59
noticeable
60 to 79
mild
80 to 100
stable
Reading bands, not clinical cut-off values. Your questions about energy and vitality are worded in-house and modelled on validated instruments, so no published cut-off value applies to precisely this score. Higher is always healthier.
This scan falls in measurement class A: a questionnaire is the usual way of measuring here, and still the reliability of your score stays capped at average as long as only your answers count. What lifts that ceiling is blood values and sleep data from a wearable, and you can add both in your full BioProfile.
On your results screen that reliability appears as a label next to your score: medium reliability, symptom based. That label is not an aside; it tells you exactly how much weight you may put on the number.
This page describes a measuring instrument, so below you can read where that instrument comes from and what has been studied about it. Every claim points to the source it appears in.
Around 2000, Bültmann and colleagues put the Checklist Individuele Spankracht to 12,095 Dutch employees: 22 per cent were fatigued and 23 per cent had psychological complaints. Of the fatigued, 43 per cent had fatigue alone, the rest had both, and the two turned out to be measurable separately from each other.1 In 2003, Kant and colleagues described the design of that Maastricht cohort study, which began in 1998 to follow long-term fatigue among working people.2
In the general population it is no better. Van ‘t Leven and colleagues surveyed 9,062 residents of Nijmegen: 30.5 percent had been tired for longer than six months, and a large share of them were not known as such by their GP.3 In Norway, Loge found in 1998, among 3,500 people, that 11.4 percent had been substantially tired for six months or longer, women more often than men.4 In the United States, Ricci counted a two-week prevalence of 37.9 percent among working people in 2007, accounting for 136 billion dollars of lost productive work time per year.5
One in five to one in three, and almost nobody has a number for it. That is the reason this scan exists.
In 1992 Lewis and Wessely gave their review of the research a title that still holds: the epidemiology of fatigue, more questions than answers.6 In 1994 Vercoulen and colleagues mapped nine separate dimensions in 298 patients with long-term fatigue, from sleep and functioning to mental wellbeing, and the Dutch fatigue questionnaires later grew out of that work.7
Van Dongen and colleagues showed in 2003 how poorly you sense this yourself: 48 healthy adults slept 4, 6 or 8 hours a night for two weeks, and at 6 hours or less the deficits in their performance piled up day after day, while after the first few days they barely felt any sleepier.8 When you cannot feel it in yourself, you need a pattern to look at. The questions in this scan follow the same thinking: two weeks, split into the parts that matter.
The Fatigue Assessment Scale by Michielsen and colleagues counts ten questions and was tested in 2003 among working people with at least twenty hours a week: a high internal consistency, the strongest loading of five fatigue questionnaires on a single factor, and fatigue turned out to be a different construct from low mood or emotional stability.9,10 De Vries and colleagues compared six questionnaires among working people and called the FAS the most promising.11
Hendriks and colleagues counted again in 2018: by then the scale had been used in 26 conditions and was available in twenty languages.12 The scale was originally written in Dutch, and that is why it is our model for the Dutch market. Our five questions follow the one-dimensional construct of that scale, in our own words. They are not a copy of it, and the card above says so in as many words.
Nijrolder and colleagues followed 571 people who came in with fatigue in Dutch general practice for a year: in 46.9 percent the GP found a condition or complaint during that year that could be related to the fatigue, in 8.2 percent a clear physical cause, and half were given no explanation.13
A questionnaire cannot tell those groups apart, and this scan does not claim to. A low score means that looking further makes sense, and nothing more. Tiredness that is new, severe or increasing, especially with the number on the scales going down, is a reason for a doctor and for a blood test, and only a doctor can make a diagnosis.
In 2006 Puetz and colleagues pooled the research on regular exercise: exercise gave more energy and less fatigue than the control groups, with an average effect of 0.37.14 In 2013 Drake and colleagues gave a dose of 400 milligrams of caffeine at zero, three and six hours before bedtime: all three disturbed sleep measurably compared with placebo, including the dose six hours earlier.15
Ricci found that working people with fatigue lost productive hours to their health 65.7 percent of the time, against 26.4 percent of working people without it.5 That is association, not cause, and that is how those studies put it too. What it does say: energy moves along with exercise, caffeine and sleep, and what moves along you can follow.
This is what the scan rests on. Now your energy score.
Fill in your first name and email address, and your energy score is in your dashboard.

This page was written by BioProfile. BioProfile sells health products and this scan is free: no purchase comes with it. The Fatigue Assessment Scale is not ours and is not free to use. That is why we ask our own five questions, modelled on that instrument, and nowhere call them a validated copy of it.
Every source below was checked on the day this page was published. The numbering follows the text: source 1 is the first one the text refers to, and the instrument the scan is built on sits among them at the point where it comes up.
Five questions, about three minutes, and your energy score is in your dashboard. Your answers stay private (GDPR).
Fill in your first name and email address, and your energy score is in your dashboard.
What this does not say. Tiredness is a complaint with many possible causes, and a questionnaire cannot tell them apart. Thyroid problems, low iron, low vitamin B12, sleep apnoea, medication and a low mood all read the same way here. Tiredness that is new, severe or increasing, especially together with the number on the scales going down, is a reason to see a doctor and have blood taken, and not a reason to work on habits.
BioProfile analyses your health status to guide you and your coach. It does not make a diagnosis, only a doctor can do that. Built on validated health questionnaires; the combined BioProfile score is not itself a validated clinical instrument yet. Your answers stay private (GDPR).