
BioProfile analysis · recovery scan
Your result in 3 minutes

Your recovery proxy across your ordinary weeks, with the reading band it falls in and, for each question, the number that set the direction. All on your own screen, in your dashboard, with the blood value named alongside as the next step.
Three questions about how you recover, how often things hurt and which way your food leans. You get a recovery proxy from 0 to 100 with the reading band alongside it, and the honest reason it is not an inflammation score. An analysis, never a diagnosis.
Free
3 questions
About 3 minutes
Proxy from 0 to 100
Fill in your first name and email address, and your recovery proxy is in your dashboard.
(and the scientifically grounded reason we print no inflammation score here)
A hard workout costs you two days now, where it used to cost one. A cold hangs on a week longer. In the morning your hands are stiff and nobody knows what from. And somewhere you have read that this is inflammation, low-grade, chronic, the word of the year, and that you can have it measured in a webshop for 89 euros.
The awkward thing about inflammation is that it is a blood measure. In the whole literature there is no questionnaire that measures systemic inflammation, and any product that gives you an inflammation score out of a questionnaire has made that score up. What a questionnaire can honestly do is this: record how quickly you recover, how often things hurt, and which way your daily food leans. Those are real things about your week. It is not a window onto your blood.
So that is exactly what we do, and that is what we call it too: three questions, added up into a recovery proxy from 0 to 100, deliberately dimmed until a blood value lies beside it. No inflammation score. No diagnosis. A direction, yes, and the most honest first step for anyone who wants to know their values: first know whether there is anything to measure.
An anti-inflammatory diet. Turmeric, omega 3, a cold water bath, a home test for CRP with nobody to read the result. All understandable, and all of them start in the same place: with what you are going to do about it.
So after two months you still do not know whether it did anything. You have recorded nowhere how you recovered when you started, and recovery is exactly the pattern you only notice when it lets you down. Without a starting value, every change is a feeling about a feeling.
We analyse the real cause first
At BioProfile we turn the order around. First we record what is there now, in three questions that are honest about what they measure, and only then do we talk about what you do with it, with the blood value as the step that turns a proxy into a result. Analyse first, advise after.
The recovery scan is the shortest step in that analysis, and the most modest: it says out loud what it is not.
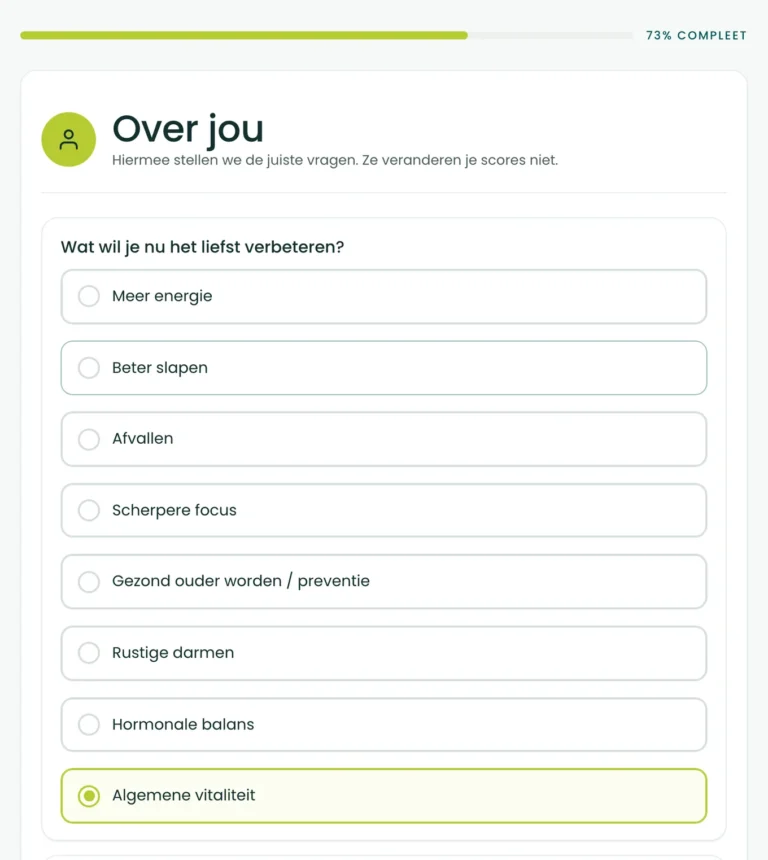
You start with eight short questions about yourself. They do not count towards your result; they make sure we can read the rest properly. One of them you may skip.
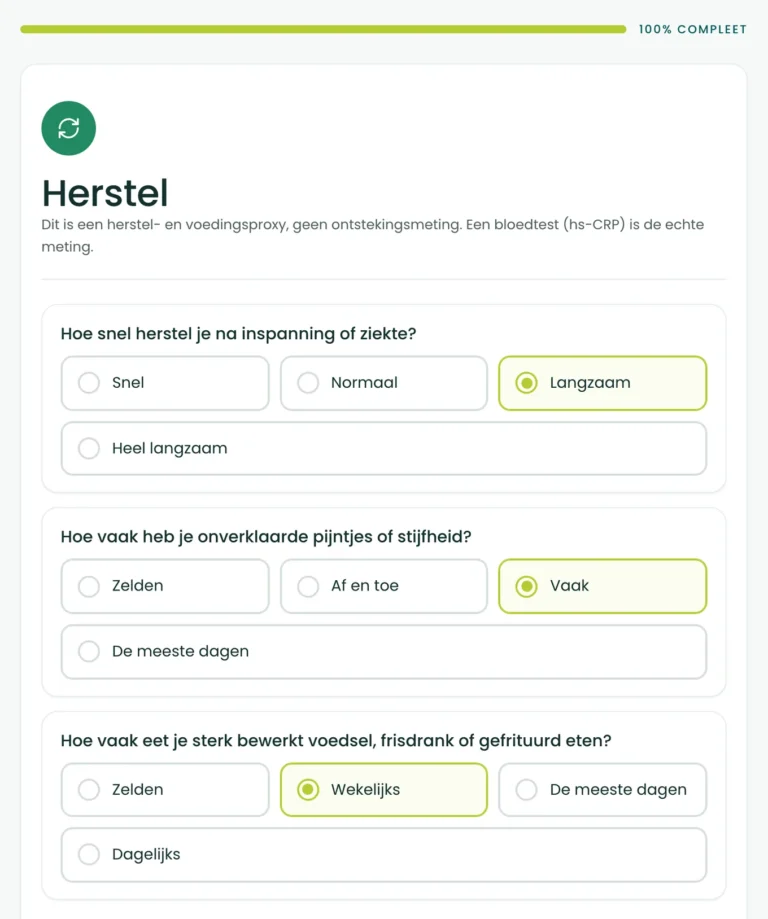
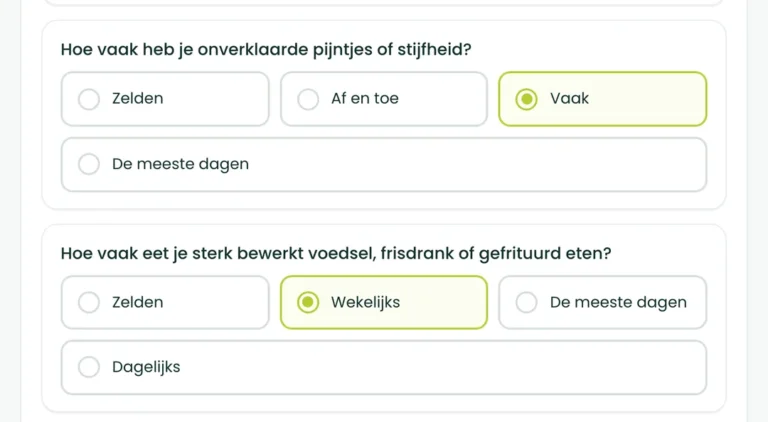
Then come the three recovery questions, about your ordinary weeks: how quickly you recover after exertion or illness, how often you have unexplained pain or stiffness, and how often you have heavily processed food and sugary drinks. Each question has four answers.
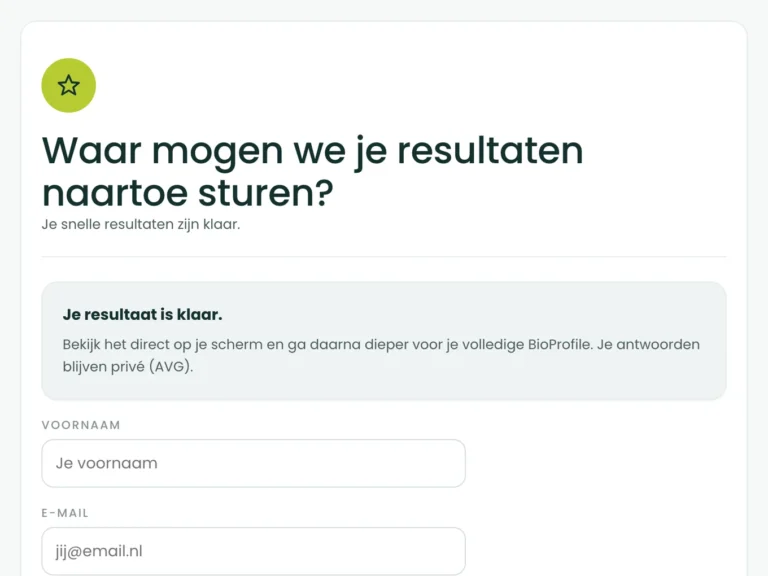
You fill in your first name and email address. You see a first picture straight away, and with one tap on your dashboard your recovery proxy is on your screen, with the reading band next to it. In your email there is a login link, so you can find your outcome again later and extend your scan with a blood value.
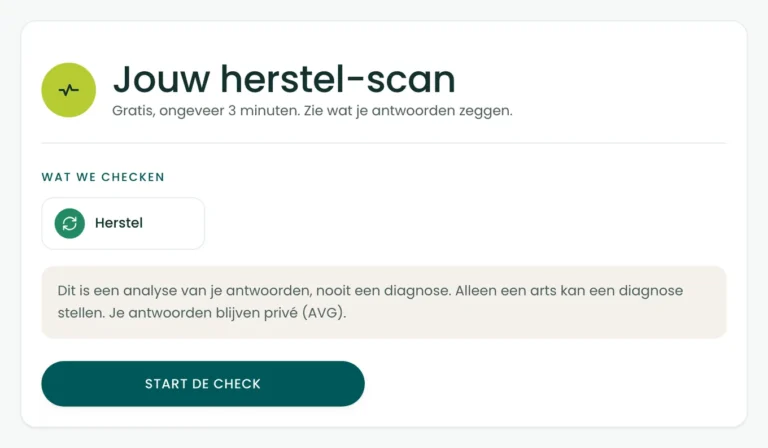
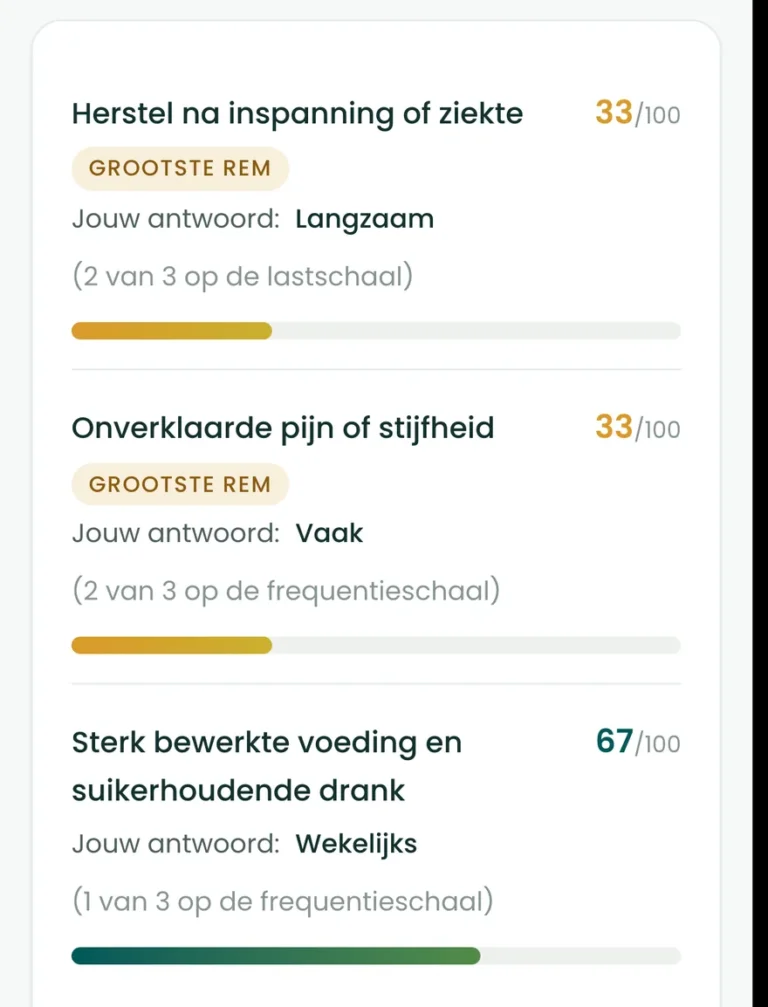
This is what is on your screen after about three minutes:
Add one blood value later and the proxy becomes a result. Until then you no longer have a feeling about your recovery, but a starting value.
Fill in your first name and email address, and your recovery proxy is in your dashboard.
Three questions about your ordinary weeks: how quickly you recover after exertion or illness, how often you have unexplained pain or stiffness, and how often you have heavily processed food and sugary drinks. For each question you pick the answer that sits closest to your weeks.
Neither of the two cards is a questionnaire, and that is the point: the first is the blood measure that really measures inflammation, the second the only published index for the inflammation-promoting potential of food. The three questions of the scan measure recovery and eating pattern, and that is why they are called a proxy.
used descriptively only
Nowhere in the literature is there a validated self-report questionnaire for systemic inflammation. The real measure is a blood value, high-sensitivity CRP. What you see here is a result about recovery and eating pattern, labelled as a proxy, and any product that gives you an inflammation score out of a questionnaire has made that score up.
Used only descriptively. We do not apply the diagnostic rule behind it here.
Validated for: measuring systemic inflammation in blood.
used descriptively only
The only published index in this field scores the inflammation promoting potential of an eating pattern, not the inflammation in a person, requires a full dietary history and is patented. That is why we ask one light question about your eating pattern, take the answer as a tendency and not as a measurement, and say so at the row as well.
Used only descriptively. We do not apply the diagnostic rule behind it here.
Validated for: the inflammation-promoting potential of food, not the inflammation of a person.
Read these rows as what they are: how quickly you recover, how often things hurt, and which way your daily food tends. Those are real things about your week. It is not a window on your blood.
This is the clearest limit in the whole analysis. Systemic inflammation is a blood measure, and no self-report instrument for it exists. We keep the row because recovery speed and eating pattern are worth knowing and worth changing, and we label it a proxy so it can never be confused with the thing it sits beside. It is deliberately capped at low reliability on answers alone, and one hs-CRP value lifts it further than any number of extra questions could.
BioProfile scoring rules, measurement class E, proxy basis, reliability capped at low on questionnaire data alone.
Each of the three questions gets 0 to 3 points, from quick to slow. The points are added up and converted into a recovery proxy from 0 to 100. Higher is better, and it is a proxy: a direction about recovery and food, and not an inflammation score.
0 to 39
slow recovery pattern
40 to 59
noticeable
60 to 79
mild
80 to 100
quick recovery pattern
Reading bands, not clinical cut-off values. Your questions about inflammation and recovery are worded in house and modelled on validated instruments, so no published cut-off value applies to precisely this score. Higher is always healthier.
This scan falls in measurement class E: there is no questionnaire that measures inflammation, so on answers alone the reliability is low and the row stays deliberately dimmed. What lifts it is one blood value, high-sensitivity CRP, and you can add that in your full BioProfile; then it is a result and no longer a proxy.
On your result screen that reliability sits as a label next to your result: low signal, proxy. That label is not an aside; it says exactly how much weight you may hang on the number.
This page describes a measuring instrument, so below you can read where that instrument comes from and what has been studied about it. Every claim points to the source it appears in.
In 1997 Ridker and colleagues measured C-reactive protein in 543 healthy men: those in the highest quarter had 2.9 times the chance of an acute heart problem and 1.9 times the chance of a vessel problem in the brain as those in the lowest quarter.1 In 2010 the Emerging Risk Factors Collaboration pooled 54 studies with 160,309 people: per threefold rise in CRP, 1.37 times the chance of a heart condition, corrected for the usual risk factors, and a comparable association with death outside heart and vascular disease.2 In 2003 the American Heart Association and the CDC set down how that blood value ought to be used in practice.3
Furman and colleagues described in 2019 how chronic low-grade inflammation is the common ground beneath the biggest causes of death, and which factors drive it: infections, too little movement, poor food, toxins and psychological stress.4 Those are the things you influence yourself. The measure stays blood. That is why this scan can only put a direction on it, and that is exactly what it does.
The only published index in this area is the DII from Shivappa and colleagues: around 6,500 articles screened, 1,943 scored, 45 dietary factors weighted for their effect on six inflammation markers.5,6 The index scores the inflammation-promoting potential of a dietary pattern, not the inflammation in a person, and it asks for a full dietary history; in the four years after publication it was used in more than 200 studies.7
Our nutrition question is a light question about the same direction, and that is why it is called a tendency and not a measurement. The blood value the analysis names, high-sensitivity CRP, is the only real measure, and adding it turns this row into a result.8
Recovery after exertion: Peake and colleagues described in 2017 how the recovery time after unaccustomed exertion depends on the damage, and that inflammation, provided it is well regulated, is in fact part of the muscle’s recovery.9 Sports science reached a consensus in 2018: a disturbed balance between load and recovery leads to under-recovery, overtraining, injuries and illness.10 So how quickly you recover is not a feeling but a signal.
Pain and stiffness: Breivik and colleagues surveyed 46,394 Europeans and found that 19 percent had been in pain for longer than six months, and 59 percent of them for between two and fifteen years.11 Nutrition: in a controlled study, Hall and colleagues put twenty adults on heavily processed food for two weeks: they ate 508 kilocalories more per day and gained 0.9 kilos.12 In 2024 Lane pulled together 45 meta-analyses covering 9.9 million people: heavily processed food was associated with 1.50 times as much death from heart and vascular disease and 1.21 times as much death in total.13 Aeberli gave 29 young men sugared drinks for three weeks: their hs-CRP rose by 60 to 109 percent.14
A low recovery proxy means slow recovery, frequent pain and an eating pattern that leans the wrong way. It is not an inflammation score, and we say so in as many words on the card above. Calder and colleagues described in 2011 how food and low-grade inflammation hang together: healthy eating patterns with wholegrains, vegetables, fruit and fish go together with lower inflammatory markers, and every meal high in sugar or fat gives a temporary peak.15
A low result means a blood value is worth it, and nothing beyond that. Irwin and colleagues showed across 72 studies with more than 50,000 people that poor sleep too hangs together with a higher CRP, so the proxy reads along with your sleep.16 Pain or stiffness that is new, that persists or that gets worse is a reason to see a doctor, and only a doctor can make a diagnosis.
In Breivik, 61 per cent of people with long-term pain were less able or unable to work outside the home, and 40 per cent received inadequate care.11 In Lane, heavily processed food was linked to 32 of the 45 outcomes studied, from mortality to mood.13
That is association, not cause, and that is how those studies put it too. What it does say: recovery, pain and food are the three things you can see moving yourself, and what moves you can follow, until the blood value tells you what sits underneath.
This is what the scan rests on. Now your recovery proxy.
Fill in your first name and email address, and your recovery proxy is in your dashboard.

This page is written by BioProfile. BioProfile sells health products and this scan is free: no purchase comes with it. There is no validated questionnaire for inflammation, and the only published dietary index in this area, the DII, is patented and not ours. So we ask three questions of our own about recovery and food, we call the result a proxy, and nowhere do we print an inflammation score.
Every source below was checked on the day this page was published. The numbering follows the text: source 1 is the first one the text refers to, and the two sources the analysis names sit in between, at the point where they come up.
Three questions, about three minutes, and your recovery proxy is in your dashboard. Your answers stay private (GDPR).
Fill in your first name and email address, and your recovery proxy is in your dashboard.
What this does not say. Nowhere in the literature is there a validated self-report questionnaire for systemic inflammation. This is not an inflammation score and we do not call it one either. The real measure is a blood value, high-sensitivity CRP, and adding that value turns this row into a result instead of a proxy. Any product that hands you an inflammation score from a questionnaire has made that score up.
BioProfile analyses your health status to guide you and your coach. It does not make a diagnosis, only a doctor can do that. Built on validated health questionnaires; the combined BioProfile score is not itself a validated clinical instrument yet. Your answers stay private (GDPR).