
BioProfile analysis · heart scan
Your result in 3 minutes
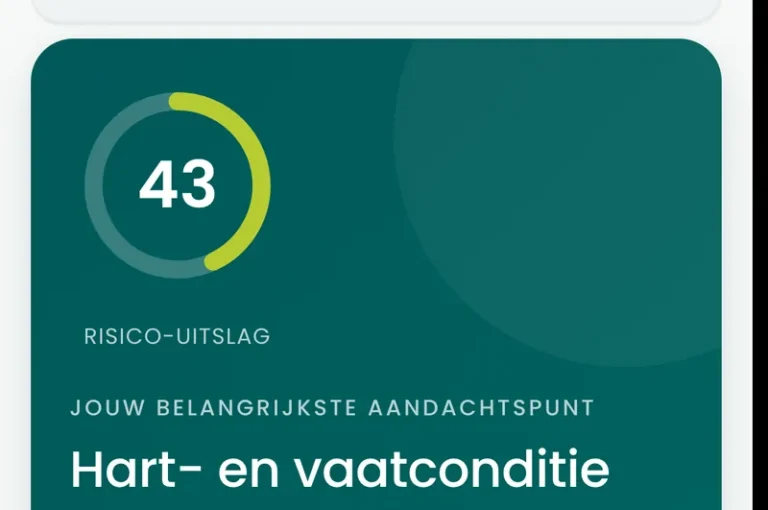
Your risk result, with the reading band it falls in and, per question, the number that set the direction. All of it on your own screen, in your dashboard, with the blood pressure named alongside it as the very next step.
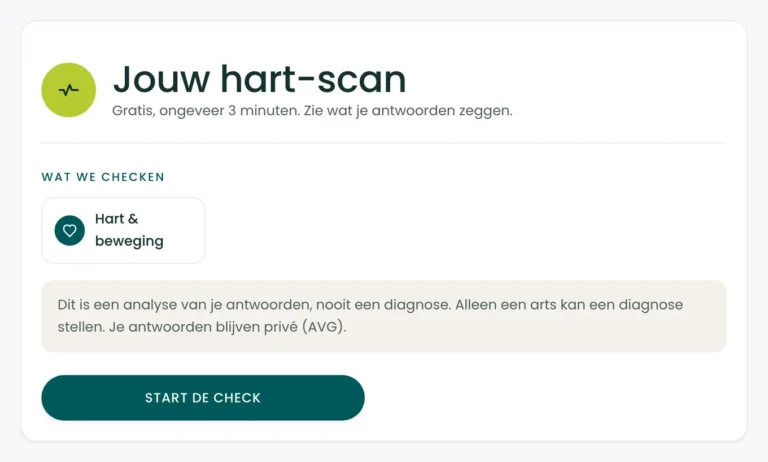
Five questions about exercise, smoking, family and fitness. You get a risk result from 0 to 100 with the reading band alongside it, and the honest reason it is not a percentage. An analysis, never a diagnosis.
Free
5 questions
About 3 minutes
Direction 0 to 100
Fill in your first name and email address, and your risk result is in your dashboard.
(and the scientifically grounded reason why this is exactly where we print no percentage)
You feel nothing. That is exactly the problem. Your father had heart trouble at sixty, you smoked for ten years and stopped, the stairs are still fine, and beyond that there is nothing you can show a doctor. So you do not go. And somewhere in your head sits a percentage you have never measured.
The awkward thing about cardiovascular risk is that it is not a symptom. It builds up over years, in a blood pressure you do not feel and a cholesterol you do not see, and the web shop with the risk test knows that: it hands you a percentage out of a questionnaire, and that percentage is not right, because every validated formula on this earth starts with a measured systolic pressure. A number that looks like a measurement and is not one is worse than no number.
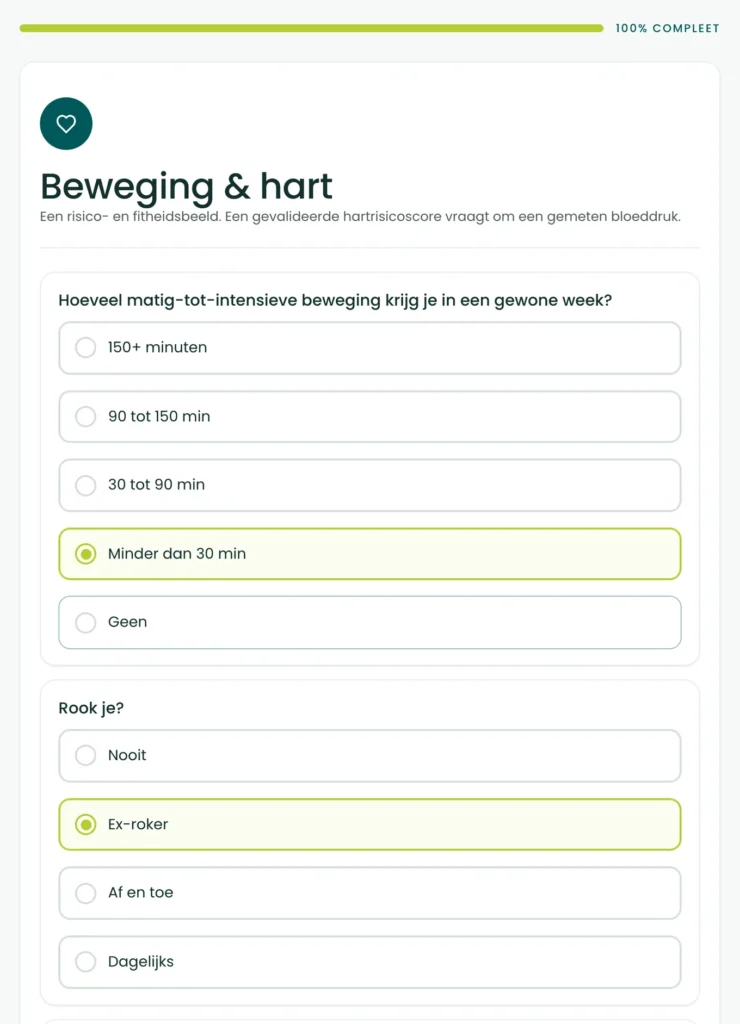
What can be done is to measure the direction from what you know yourself: how much you move, how the stairs go, whether you smoke, what runs in your family and what a doctor has already diagnosed. Two of those five build a number from 0 to 100, the other three count as risk factors in the conversation that follows. No percentage. No diagnosis. A direction, yes, and an honest next step: a blood pressure measurement.
A pot of fish oil. A blood pressure monitor that ends up in the cupboard, a risk test from a web shop, an intention to start running. All of it understandable, and all of it starts in the same place: with what you are going to do about it.
As a result, six months later you still do not know where you stood. You recorded nowhere how you moved and how the stairs went when you started, and a risk you do not feel changes without you feeling it too. Without a starting value, every improvement is a feeling about a feeling.
We analyse the real cause first
At BioProfile we turn the order around. First record what is there now, with the questions the published risk scores ask as well, and with the limit stated alongside: a direction, not a percentage, until a measured blood pressure sits next to it. Only then talk about what you do with it. Analyse first, only then advise.
The heart scan is the first step of that analysis, and the step that tells you which measurement ought to be the next one.
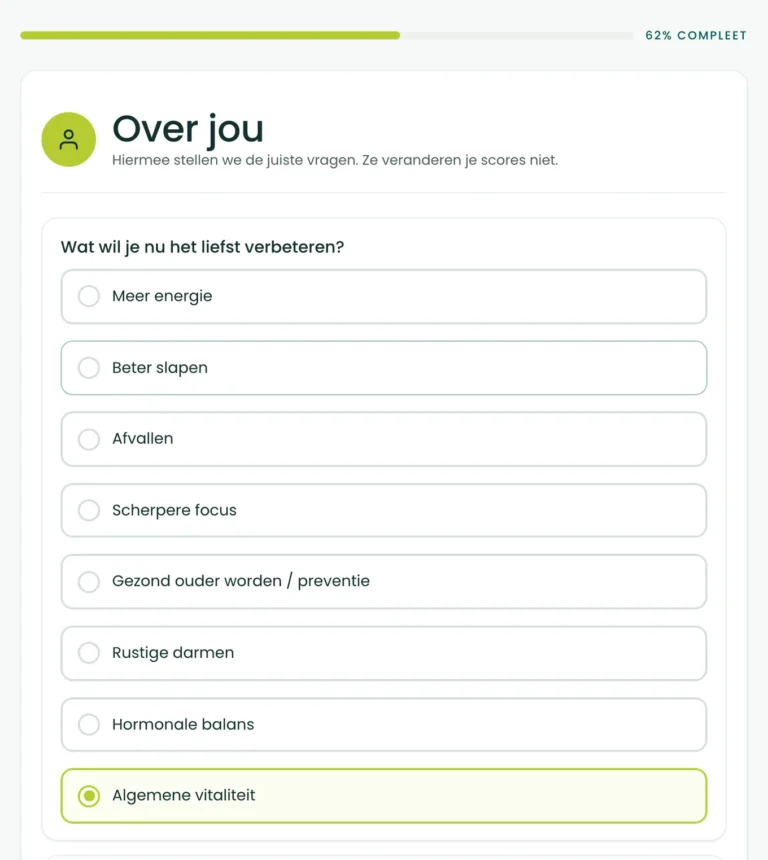
You start with eight short questions about yourself, among them your height, weight and waist: those give the waist to height ratio, a measure your full BioProfile adopts word for word. One of them you may skip.
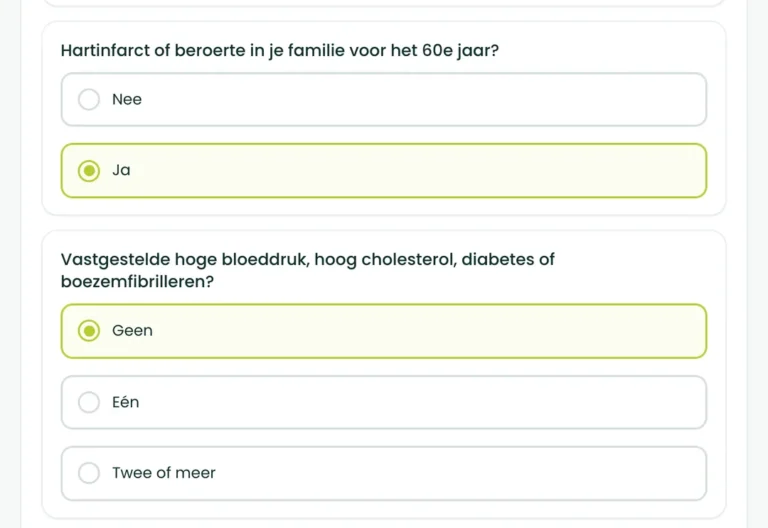
Then come the five heart questions: your weekly moderate to vigorous activity, smoking, family history of heart and vascular disease, diagnosed conditions, and whether you can manage two flights of stairs. Each question has two to five answers.
You fill in your first name and email address. You see a first picture straight away, and with a tap on your dashboard your risk result is on your screen, with the reading band alongside it. In your email there is a login link so you can find your outcome again later and extend your scan with a measured blood pressure and blood values.
This is what is on your screen after about three minutes:
Add a measured blood pressure later and the direction becomes a score. Until then you no longer have a feeling about your heart, but a starting value.
Fill in your first name and email address, and your risk result is in your dashboard.
Five questions about your ordinary week and your history. Two of them build the number: your weekly exercise and the stairs. Smoking, a family history of heart and blood vessel disease and diagnosed conditions are recorded as risk factors and do not move the number; they belong to the conversation about a measured blood pressure.
The first card is the instrument the activity question is modelled on. The second is the waist-to-height ratio, which the scan takes word for word from your first questions: your waist and your height.
modelled on
The standard questionnaire for self-reported physical activity, with a test-retest reliability around 0.80 but a criterion validity of only about 0.30 against an accelerometer. In plain words: people report consistently, but not very accurately. That is exactly why your answer about movement here sets down a direction and never a number we would call measured fitness.
Modelled on, not validated as, this instrument.
Validated for: self-reported level of physical activity.
used word for word
A freely available measure that you can take yourself at home, where a ratio of 0.5 or higher points to belly fat that deserves attention. That is why we ask about your waist and not only your weight: where the fat sits predicts metabolic risk better than how much you weigh.
Used as published, word for word.
Validated for: screening for abdominal fat and cardiometabolic risk.
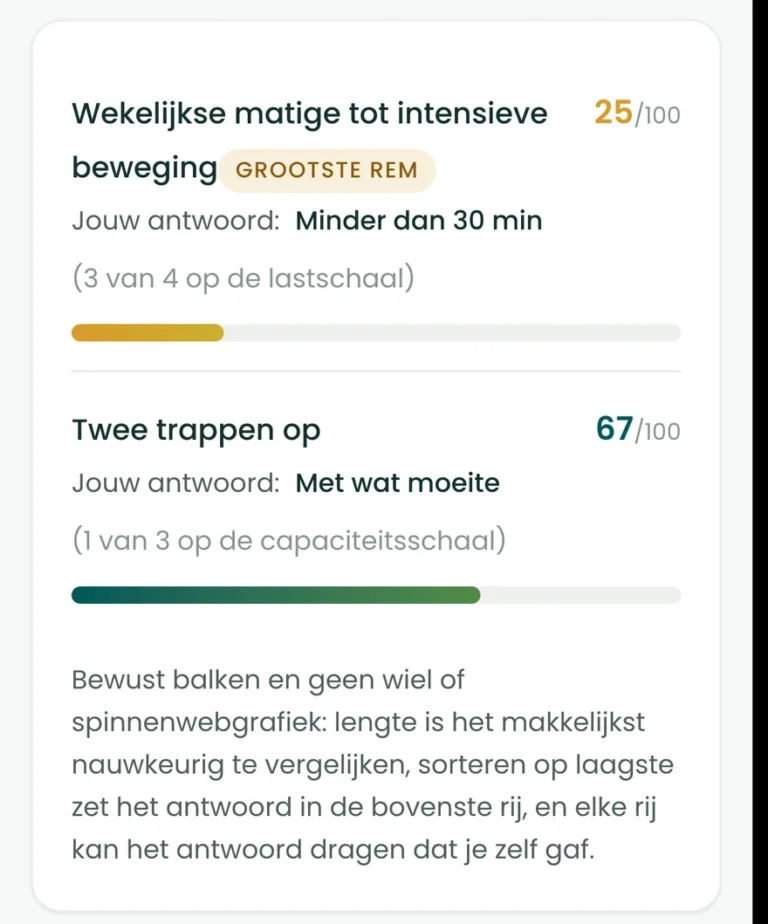
The stairs question is the most useful row here, because it is the only thing in this section that comes close to a physical test instead of a report of behaviour. It is a rough capacity check, and rough is still better than nothing when the alternative is your own estimate of your fitness.
Cardiovascular risk is subclinical: it builds up without symptoms, so there is nothing honest to ask about. The validated risk formulas need at least a measured systolic pressure, and usually cholesterol too, and neither is something you can give reliably from memory. So we build a direction out of activity and risk factors, we say that it is a direction, and we send you towards a measured blood pressure instead of inventing a number that looks like a measurement.
BioProfile scoring rules, measurement class D, risk basis, confidence capped at low on the basis of questionnaire data alone.
Two of the five questions build the result: your weekly exercise (0 to 4 points) and the stairs (0 to 3 points). The points are added up and converted into a risk result from 0 to 100. Higher is better, and it is a direction and not a percentage.
0 to 39
high risk signal
40 to 59
elevated risk signal
60 to 79
limited risk signal
80 to 100
low risk signal
Reading bands, not clinical cut-off values. Your questions about cardiovascular condition are worded in house and modelled on validated instruments, so no published cut-off value applies to precisely this score. Higher is always healthier.
This scan falls in measurement class D: cardiovascular risk builds up without symptoms, so on answers alone the reliability stays low, and the page says so. What lifts it are a measured blood pressure and a cholesterol value, and you can add both in your full BioProfile; only then does a direction become a score.
On your result screen that reliability stands as a label next to your result: low signal, risk indicator. That label is not a side note; it says exactly how much weight you may hang on the number.
This page describes a measuring instrument, so below you can read where that instrument comes from and what has been studied about it. Every claim points to the source it appears in.
In the INTERHEART study, Yusuf and colleagues compared 15,152 people with a first acute heart problem with 14,820 people without one, across 52 countries: smoking (2.87 times the odds), a disturbed fat profile, a blood pressure that is too high, a disturbed blood sugar, abdominal fat, psychosocial strain, little fruit and vegetables, alcohol and too little exercise together explained 90 per cent of the attributable risk in men and 94 per cent in women.1 In the PURE study they followed 155,722 people in 21 countries: about 70 per cent of the heart and blood vessel events and deaths could be attributed to modifiable factors, with blood pressure as the largest.2
Doll and colleagues followed 34,439 British doctors for fifty years: those who kept smoking died on average ten years earlier than those who never smoked; stopping at thirty kept almost the whole difference from arising, and stopping at fifty kept half of it from arising.3 Jha found the same in 2013 among more than 200,000 Americans: smokers lost at least ten years, and stopping before forty took away 90 per cent of the extra risk.4
Nine in ten, ten years, and none of those factors hurts. That is why this scan exists: not to frighten you, but to record what you already know yourself.
The European SCORE2 formula, built in 2021 on 45 cohorts with 677,684 people and tested in another 25, works with age, smoking, measured systolic pressure and measured cholesterol; the same fifty-year-old smoker with a systolic pressure of 140 comes out at 5.9 per cent in low risk countries and 14.0 per cent in very high risk countries.5 The risk charts of the World Health Organization, rebuilt in 2019 on 376,177 people from 85 cohorts, work with the same measured values.6 The European cardiologists prescribe SCORE2 in their guideline.7
In 2016 Damen and colleagues in Utrecht counted 363 published risk models: smoking was in 90 per cent, age in 88, and only 36 per cent of the models had ever been tested outside their own data.8 None of those models works without a measured blood pressure, and Rapsomaniki showed why in 1.25 million people: the lowest risk sat at a systolic pressure of 90 to 114, and every step above that counted.9 That is why we print no percentage. A direction from what you do know, and a blood pressure measurement as the next step, is the most honest thing a questionnaire can do.
The activity question is modelled on the International Physical Activity Questionnaire, which proved consistent across twelve countries (repeatability around 0.80) and not very accurate (validity around 0.30 against an accelerometer), and gives a direction and not a fitness number for exactly that reason.10 The stairs question is the most useful row: the only thing that comes close to a physical test. Myers and colleagues followed 6,213 men and found that exercise capacity was the strongest predictor of death, stronger than the established risk factors, with 12 per cent better survival per extra MET.11 Kodama pooled 33 studies with 102,980 people: people with low fitness were 1.70 times as likely to die as people with high fitness.12
The family question comes from Framingham: in 2302 adults, Lloyd-Jones found that a parent with early heart or vascular disease raised the chance of an event of your own within eight years by 2.6 times in men and by 2.3 times in women.13 And the waist to height ratio from your first questions: Ashwell pooled 31 studies covering more than 300,000 adults and found that waist divided by height picks up heart and metabolic risk better than waist circumference and BMI, with a cut-off of 0.5.14,15
A low risk result means the direction is unfavourable: little activity, stairs that feel heavy, and risk factors that are fixed. It is not a validated ten year risk score and not a fitness test, and we say so in as many words on the card above. A high result does not mean your heart is in order either: the risk that matters sits in a blood pressure and a cholesterol this scan does not see.
What a low result does mean is that the next step should be measured and not felt. Pain or pressure in the chest during exertion, or shortness of breath that is new, is a reason to contact a doctor now, and only a doctor can make a diagnosis.
Lee and colleagues calculated that too little physical activity causes 6 per cent of the worldwide burden of cardiac conditions and 9 per cent of premature death, and that 10 per cent less inactivity would already mean more than 533,000 fewer deaths a year.16 In Kodama’s work, each MET of fitness, roughly being able to walk one kilometre an hour faster, meant 13 per cent less mortality.12
That is association from cohorts, not a promise about your heart, and that is how those studies put it too. What it does say: of the five things this scan asks about, activity and fitness are the two you can shift yourself, and those two are exactly what build the number.
This is what the scan stands on. Now your direction.
Fill in your first name and email address, and your risk result is in your dashboard.

This page is written by BioProfile. BioProfile sells health products and this scan is free: no purchase comes with it. The activity question is modelled on the International Physical Activity Questionnaire, which is not ours; the waist to height ratio is freely available and we adopt it as published. And we do not print a risk percentage, because no validated formula can do that without a measured blood pressure.
Every source below was checked on the day this page was published. The numbering follows the text: source 1 is the first one the text refers to, and the two instruments the analysis names sit in between, at the point where they come up.
Five questions, about three minutes, and your risk result is in your dashboard. Your answers stay private (GDPR).
Fill in your first name and email address, and your risk result is in your dashboard.
What this does not say. This is not a validated ten-year heart risk score and not a fitness test. Every published risk formula needs at least a measured blood pressure, and most need cholesterol values too. Pain or pressure in the chest during exertion, or shortness of breath that is new, is a reason to contact a doctor now, and not something to read off a page.
BioProfile analyses your health status to guide you and your coach. It does not make a diagnosis, only a doctor can do that. Built on validated health questionnaires; the combined BioProfile score is not itself a validated clinical instrument yet. Your answers stay private (GDPR).